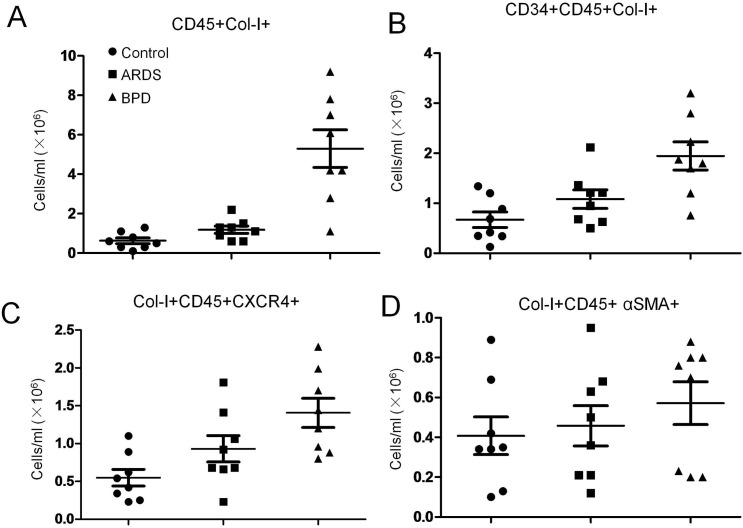
Fig 2. Flow cytometric analysis of circulating fibrocyte subpopulations on patients with BPD, ARDS and normal subjects.
Scatter plot indicated average number of (A) CD45+Col-I+, (B) CD34+CD45+Col-I+, (C) Col-I+CD45+CXCR4+, (D) Col-I+CD45+ αSMA, were presented respectively. Horizontal lines represent mean ± SEM.

