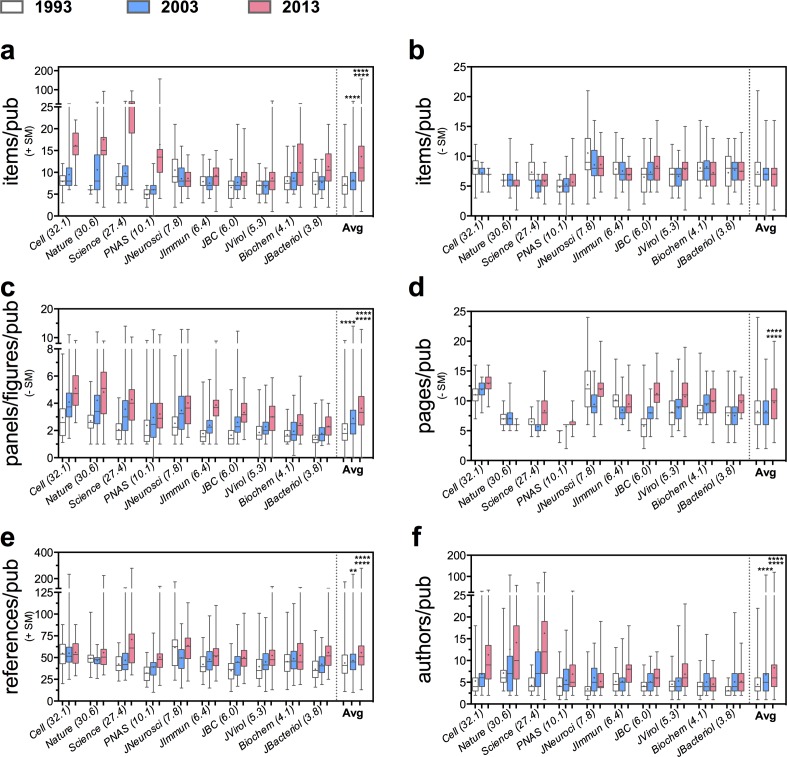
Fig 1. Increase in the Average Publishable Unit (APU) over the past two decades of scientific publication.
A total of 1464 research articles were visually-inspected to quantify: the average number of (a) total data items (including supplemental material, +SM); (b) data items in main article alone (-SM); (c) PPF ratio or panels inside composite figures (-SM); (d) pages (-SM), (e) references (+SM), and (f) authors per publications in 1993 (white), 2003 (blue), and 2013 (red) by 10 scholarly journals with diverse average IF (in parenthesis). Box plots display the average median (horizontal line in the box interior), interquartile range or distance between the 25th and 75th percentiles (box limits), and the minimum and maximum values (vertical lines issuing from the box) for each variable measured. The mean is indicated by the “+” symbol inside the box interior. Averages considering all articles (487 articles for 1993, 484 for 2003, and 493 for 2013) from all journals are shown on the right-end (note divisor line). Kruskal-Wallis non-parametric statistical test: *P≤0.05; **P≤0.01; ***P≤0.001; ****P≤0.0001. For the year 2013, top and bottom asterisks correspond to statistical analysis between 2013–1993 and 2013–2003, respectively.

