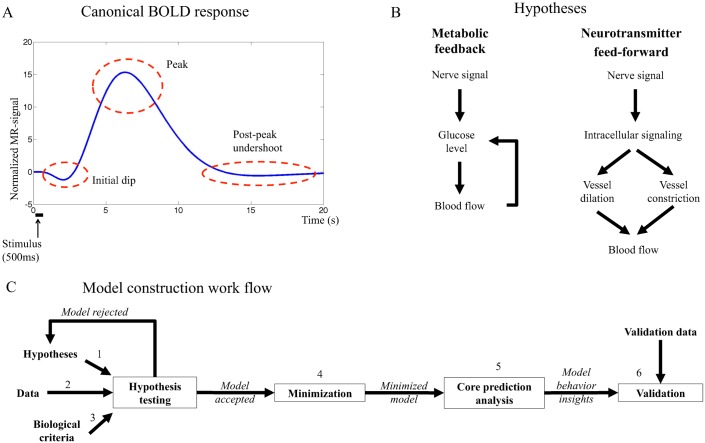
Fig 1.
A. Canonical BOLD response to a brief stimulus. The initial dip, the peak and the post-peak undershoot are marked in the figure. B. Main mechanisms of the hypotheses investigated in this work. The metabolic hypothesis (left) suggests feedback signaling where decreased blood glucose levels trigger cerebral blood flow (CBF) increase, which in turn delivers more glucose to the activated area. The neurotransmitter feed-forward hypothesis (right) suggests feed-forward signaling with two competing arms where the negative arm results in decreased CBF and the positive in increased CBF. The balance between the actions in both arms determines the shape of the BOLD response. C. The model construction workflow in this article. The biological hypothesis is translated to equations firmly based in the biological mechanisms (1), this system of equations is the model structure. Data is collected (2) and the model structure is fitted to the data by optimizing the parameters. If the model can not fit the data, the model structure is rejected or altered. If the model can fit the data, it is analyzed and evaluated to control that it does so in a biologically plausible way (3). If the model does not fulfil these criteria, it is rejected. If the model is accepted, the model is minimized in order to identify key mechanisms of the system (4) and core predictions of not yet performed experiments are made (5). In the next step, new data are collected, using experimental setup based on previous predictions, and the model predictions are compared to the new data set (6). If the predictions are satisfactory, the model is accepted. If the predictions fail the model is rejected, and a new iteration of alterations and analyses is performed taking both old and new data into consideration. The model construction workflow can be iterated as many times as needed until a satisfactory model has been reached.

