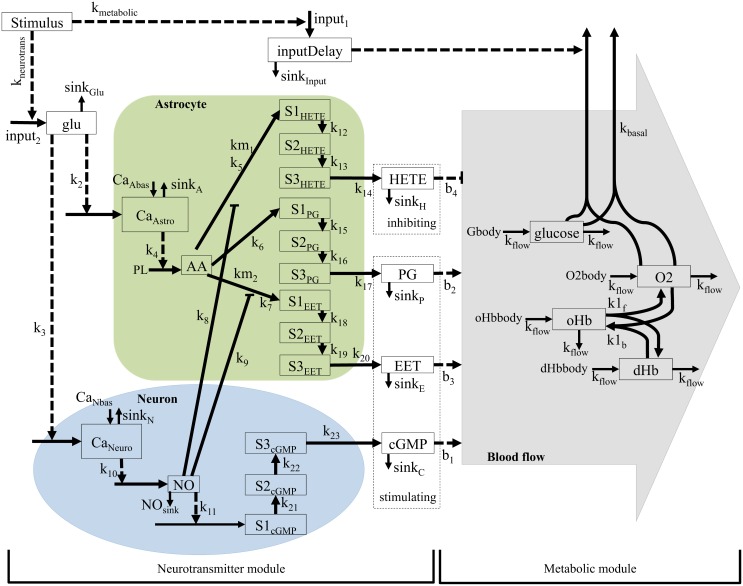
Fig 7. Interaction graph of the extended model structure Mnm1.
The model structure has two modules: the neurotransmitter module, which controls the blood flow, and the metabolic module, which controls the oxygen and glucose metabolism. Whole squares = states, dashed squares = variables (dependent on states), whole arrows = transformations, dashed arrows = interactions, green area = astrocyte, blue area = neuron, grey area = blood. All states starting with S and a number (e.g S2PG) are delay states. Stimulus = input signal. oHb and dHb are oxyhemoglobin and deoxyhemoglobin, respectively. Glu = glutamate, Calcium neuron and calcium astrocyte = calcium ion (Ca2+) level in the cell, NO = nitric oxide, cGMP = cyclic guanosine monophosphate, AA = arachidonic acid, EET = epoxyeicosatrienoic acids, PG = prostaglandins and 20—HETE = hydroxyeicosatetraeonic acid. All terms starting with k (e.g k1), are parameters and in most cases represent rate constants. PL is a parameter representing phospholipase A2, which is present in abundance. Gbody, O2body, oHbbody and dHbbody, are variables representing the glucose, oxygen and hemoglobin delivered into the area.

