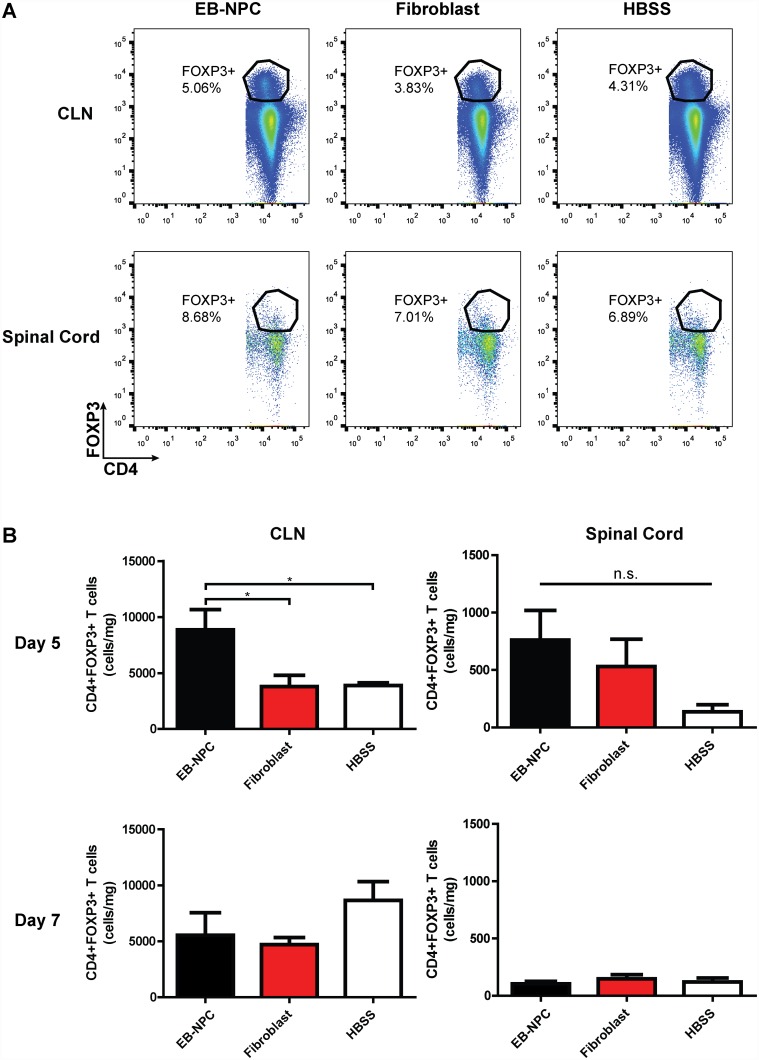
Fig 5. Regulatory T cells are increased in the draining cervical lymph nodes as a result of transient EB-NPC engraftment.
(A) Representative FACS plots of CD4+FOXP3+ cell analysis from the draining cervical lymph nodes (CLN; top) and spinal cords (bottom) of mice injected with EB-NPCs, fibroblasts, or HBSS. (B) Quantification of the number of CD4+FOXP3+ Tregs demonstrated a significant (p < 0.05) increase in the CLNs of EB-NPC transplanted mice compared to controls at day 5 p.t. (top). An increase in Tregs was not detected in the CLNs or spinal cords of EB-NPC transplanted mice by day 7 p.t. (bottom). Data represents two independent experiments. For day 5 analysis, n = 4 (EB-NPC), n = 6 (Fibroblast), and n = 4 (HBSS) animals per group. For day 7 analysis, n = 6 (EB-NPC), n = 7 (Fibroblast), and n = 5 (HBSS) animals per group. Data is presented as average ± SEM and was analyzed using one-way ANOVA followed by Tukey’s multiple comparison test.

