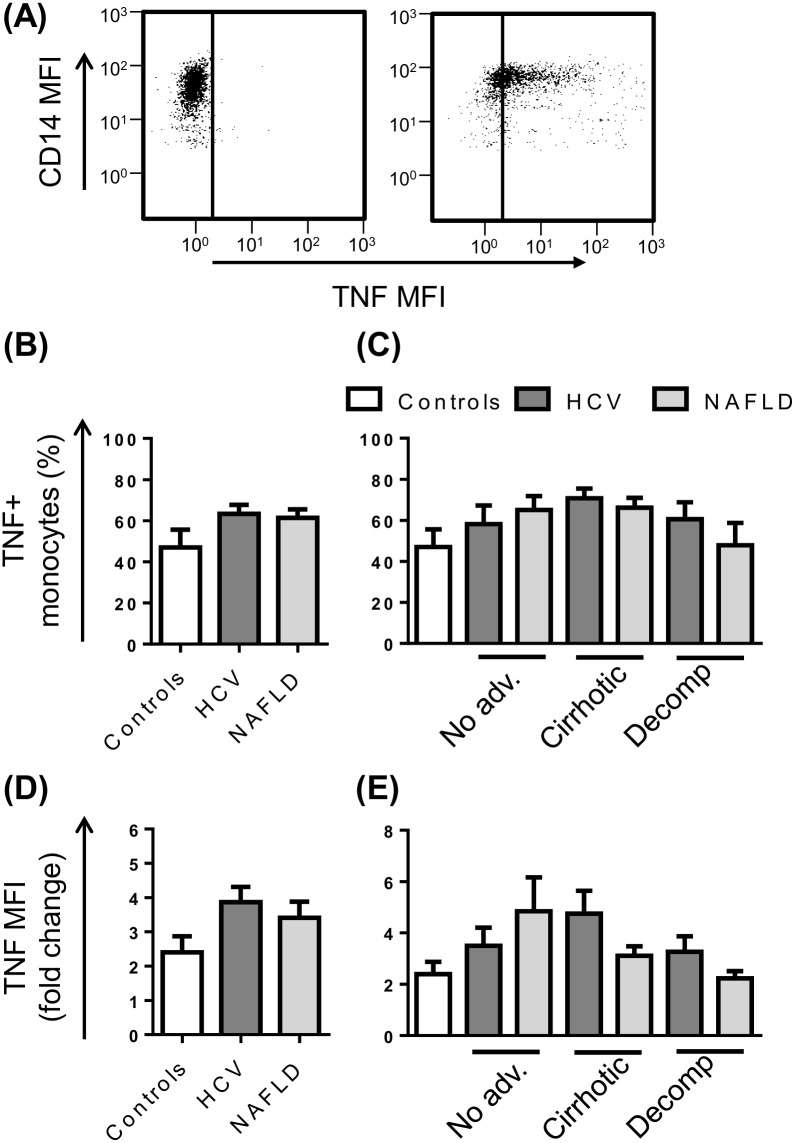
Fig 6. Monocyte TNF production in patients with chronic liver disease (CLD).
(A) Representative flow cytometry plots highlighting monocyte specific TNF production at baseline or upon stimulation with LPS. The proportion of monocytes producing TNF (B and C) and the level of TNF production (D and E) following stimulation with LPS in control subjects and CLD patients with no advanced fibrosis (No adv.), cirrhosis or decompensated cirrhosis (Decomp). (Data represented as mean +SEM).

