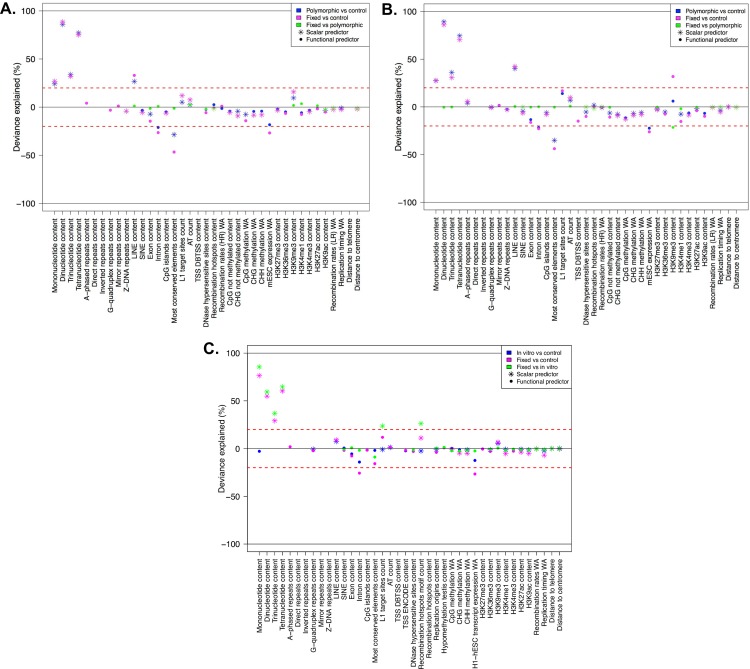
Fig 7.
Deviance explained by individual predictors in single logistic regression fits, concerning (A) ETns, (B) IAPs, and (C) HERV-Ks. Each panel contains color-coded results from three comparisons–magenta: fixed vs. controls, blue: polymorphic (or in vitro) vs controls, green: fixed vs. polymorphic (or in vitro). Only features that resulted significant in the ITP are considered here as scalar or functional predictors (indicated with stars and points, respectively), depending on whether they were IDL or LDL features. The deviance explained (between 0 and 100%) is reported as positive or negative depending on the sign of the estimated predictor coefficient (the predominant sign in the case of functional predictors). The red lines at ±20% represent the threshold above (below) which “dominant” predictors were omitted from the subsequent multiple FLR modeling.

