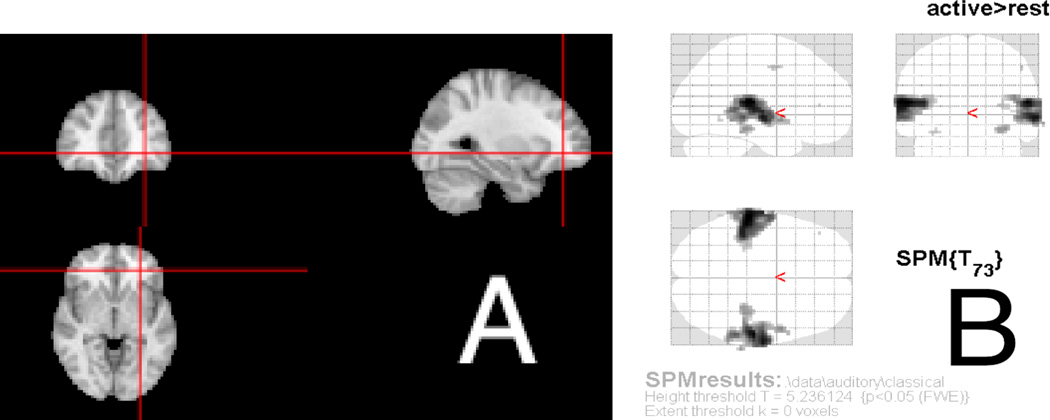
Figure 1.
Example of an othrographic representation of the brain (A), where the brain is displayed axially (bottom), coronally (top left), and sagitally (top right). Cross-hairs (red) are shown to orient the user to how certain areas fall in each dimension. Figures using maximum intensity projections show a similar set of 3 transparent views, known as “glass brains”, such as (B) from the SPM8 manual, showing how certain information (in this case activation) corresponds spatially (Ashburner et al., 2008).

