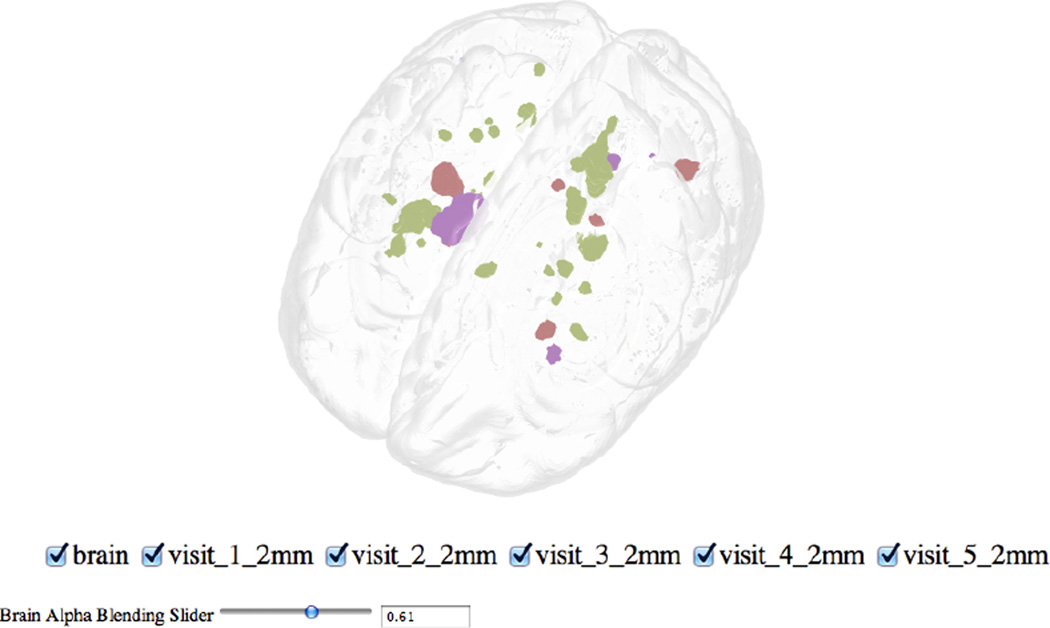
Figure 4.
Example of a 4D Figure: a 3D rendered brain (gray) and areas of enlarging white matter lesions in a patient with MS over different followup visits (multiple colors). The checkboxes switch between lesion enlargements at different followup visits and can display multiple visits simultaneously. The brain alpha blending slider (bottom left) allows you to change the opacity of the brain image; this feature can also be added for each surface. We observe that lesions enlarge at many different regions over different visits. The interactive version is located at http://bit.ly/1kEJH6q, and code http://bit.ly/1kdnWeg

