
FIGURE 4.
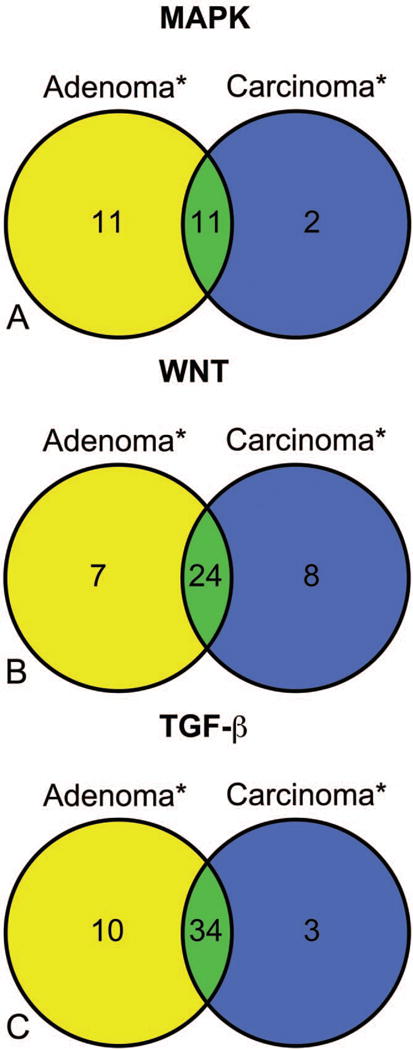
The venn diagrams represent the number of differentially expressed genes (*), within the Aloe vera non-decolorized whole leaf extract exposed F344 large intestinal adenoma and carcinoma samples compared to control colon tissue, by multiple pairwise comparisons and the statistical significance was determined by controlling the false discovery rate (FDR) at a nominal 5% level. (A) MAPK signaling; (B) WNT signaling; (C) TGF-β signaling.