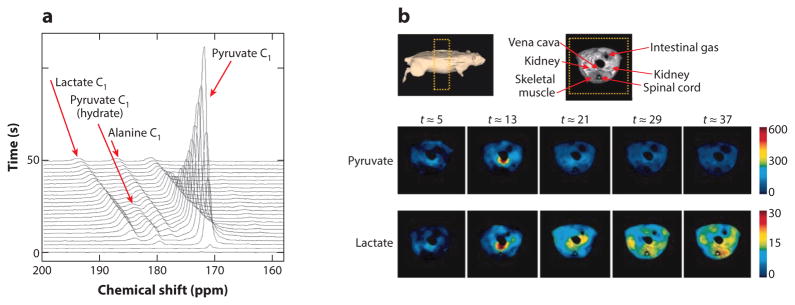
Figure 6.
In vivo detection of the conversion of pyruvate to lactate using hyperpolarized 13C magnetic resonance imaging (MRI). (a) Stack of MR spectra showing the time course of the decay of pyruvate and the buildup of lactate in the MR image of a rat. (b) 1H MR image of the rat showing the location of muscle. Temporal parametric maps of the biodistributions of pyruvate and lactate show the production of lactate in muscle. Reproduced with permission from Reference 98.

