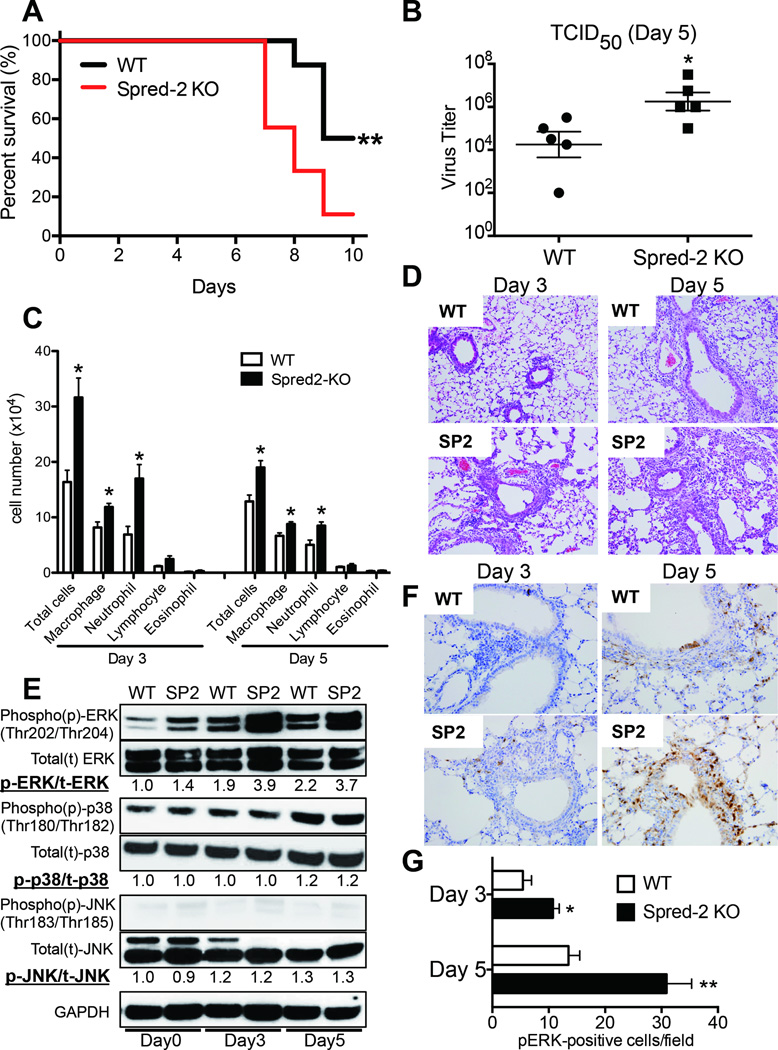
Figure 2. Spred-2 deficiency abrogates survival rate, viral load and lung pathology.
(A) Survival rate of WT and Spred-2 KO mice after intranasal injection with H1N1 at 1 × 10² pfu. Results are expressed as the percentage of survival from 16 individual mice per group. **p < 0.01 compared with WT mice.(B) Viral load in WT and Spred-2 KO mice at day 5 after intranasal injection with H1N1 (1 × 10² pfu). *p < 0.05 compared with H1N1 injection group treated with WT mice. Data shown indicate mean ± SEM and are from a representative experiment of 2 independent experiments. Each time point indicates 5 mice per group. (C) Cellular analysis of BAL from WT and Spred-2 KO mice at days 3 and 5 after intranasal injection with H1N1. *p < 0.05 compared with WT mice. Data shown indicate mean ± SEM and are from a representative experiment of 2 independent experiments. Each time point indicates 5 mice per group. (D) Histological appearance of lungs isolated from WT and Spred-2 KO mice at days 3 and 5 after intranasal injection with H1N1. Shown are representative sections from 1 mouse of 5 per group. H&E staining. Original magnification, ×100. (E) Lungs from WT and Spred-2 KO mice were harvested at day 0, 3, and 5 after H1N1 challenge and extracts were immunoblotted with phosphorylated (p)-ERK, ERK, p-p38, p38, p-JNK, JNK, or GAPDH Abs. GAPDH was used as a loading control. Experiment was repeated three times. A representative gel images and the value of phosphorylation compared with lung from WT mice (Day 0) are shown. (F) Immunohistochemical examination showed increased number of phosphorylated ERK-positive cells in Spred-2 KO mice. Shown are representative sections from 1 mouse of 5 per group. Original magnification, ×200. (G) Average number of pERK-positive cells per each field at x200 magnification, 10 fields per lung, 5 lungs per group. *p < 0.05, **p < 0.01 compared with WT mice. SP2 = Spred-2 KO

