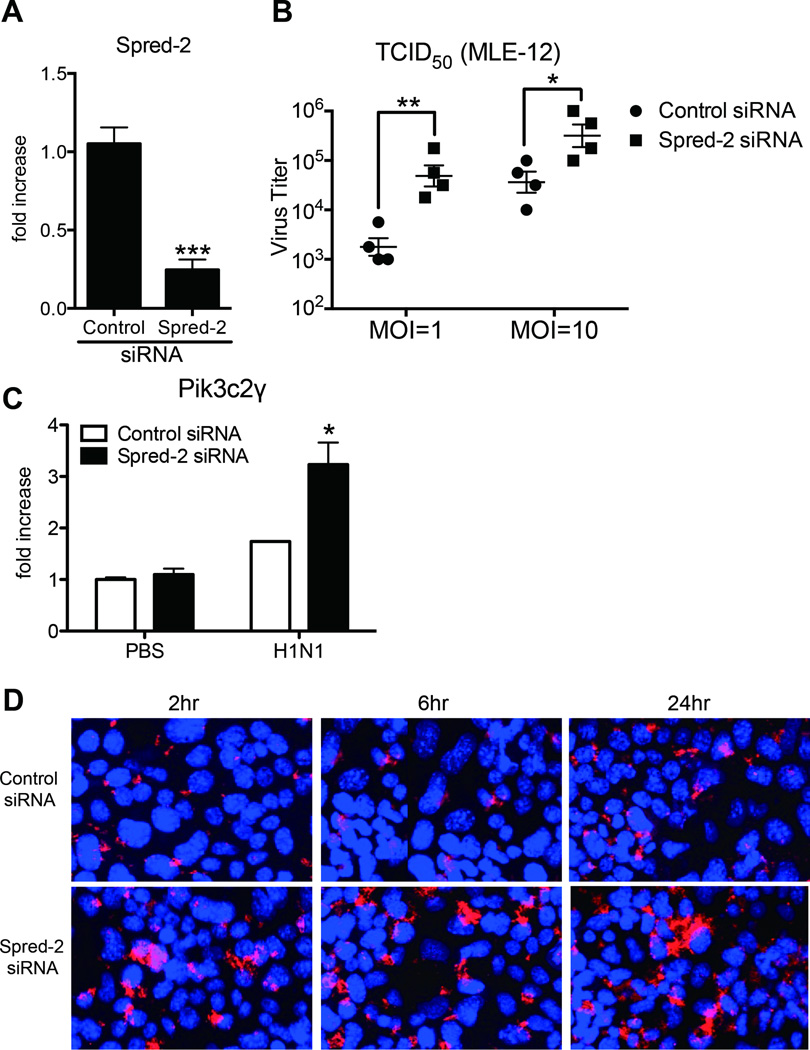
Figure 7. Spred-2 gene knock down induced aggravated influenza virus replication.
(A) Gene expression of Spred-2 from MLE-12 cells following control or Spred-2 siRNA-transfection. ***p < 0.001 compared with control siRNA-transfected MLE-12. Data shown indicate mean ± SEM and are combined from 3 independent experiments. (B) Control siRNA- or Spred-2 siRNA-transfected MLE-12 cells were infected with H1N1 (multiplicity of infection [MOI] = 1 or 10) for 10 hours. The viral load of infectious particles produced from these infections were determined using TCID50. *p < 0.05, **p < 0.01 compared with control siRNA-transfected MLE-12. Data shown indicate mean ± SEM and are from a representative experiment of 2 independent experiments. (C) Gene expression of Pik3c2γ following H1N1 stimulation for 24 hours in MLE-12 transfected with control siRNA or Spred-2 siRNA. *p < 0.05 compared with control siRNA-transfected MLE-12. Data shown indicate mean ± SEM and are combined from 3 independent experiments. (D) MLE-12 cells transfected with control siRNA or Spred-2 siRNA were infected with H1N1 (MOI = 10) for 2, 6 or 24 hours and then analyzed using anti-NP specific antibody in immunofluorescence assay and confocal laser microscopy. Red staining indicates influenza virus NP. Blue staining indicates nuclear staining, DAPI. Original magnification, ×400. Data are a representative experiment of 3 independent experiments.

