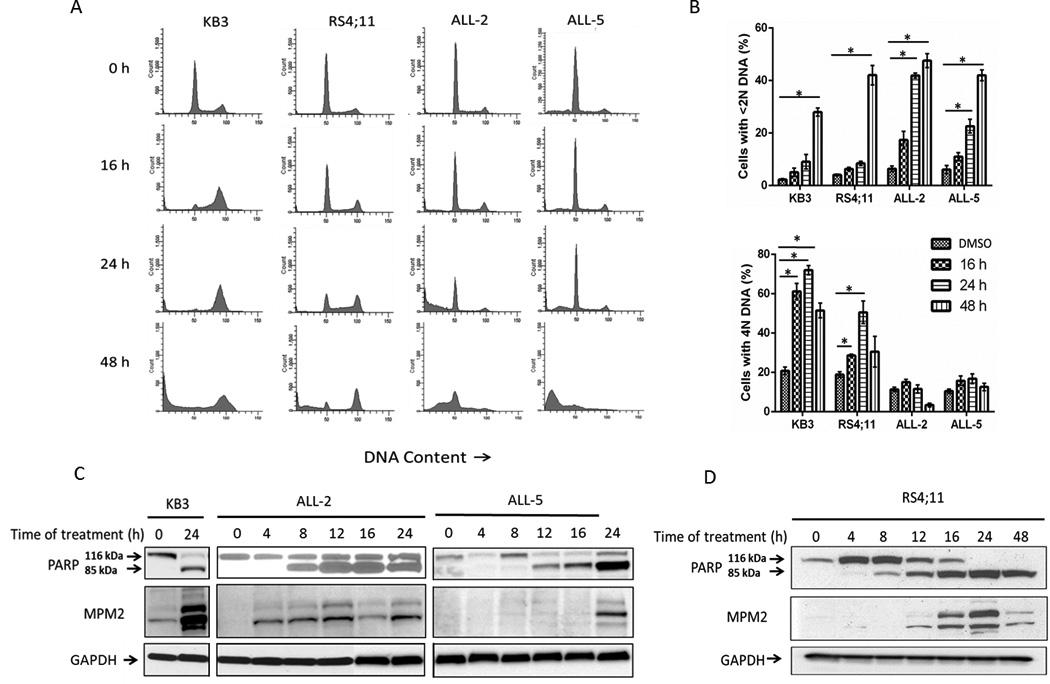
Fig. 1. Vincristine induces cell death without prior robust mitotic arrest in primary ALL cultures.

A. Flow cytometric analysis for cell cycle distribution of KB3, RS4;11, ALL-2 and ALL-5 cells, untreated or treated with 100 nM vincristine for the times indicated. Histograms are representative of three independent experiments. B. Quantitation of data from panel A showing the proportion of cells with <2N (sub-G1) or 4N (G2/M) DNA content with respect to time of vincristine treatment. Results are expressed as mean ± S.D. (n = 3). *p ≤ 0.05 (Student’s t test). C, D. Kinetics of PARP cleavage and relationship to the mitotic marker MPM2. Extracts were made from untreated or vincristine-treated (100 nM) KB3, ALL-2, or ALL-5 (C) or RS4;11 (D) cells at the times indicated and subjected to immunoblotting for PARP or MPM2. Intact and cleaved species of PARP are shown. GAPDH was used as a loading control.
