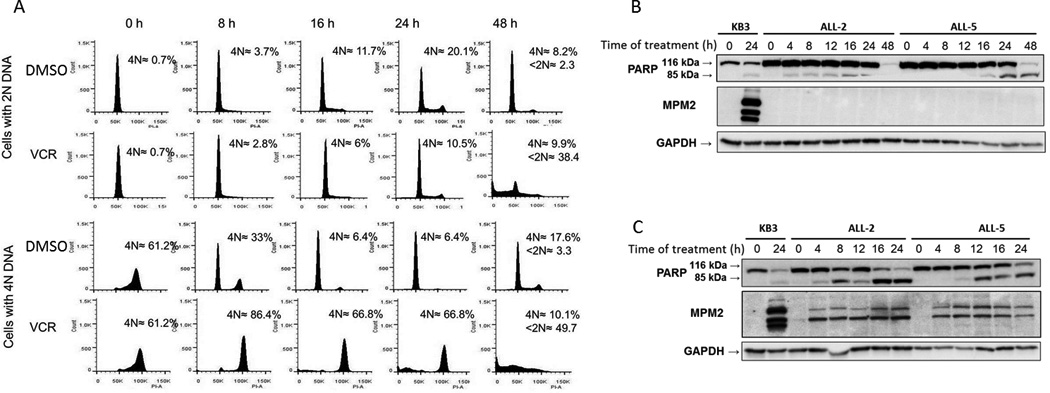
Fig. 2. Distinct responses of primary ALL cells to vincristine in different phases of the cell cycle.

A. ALL-2 cells separated by centrifugal elutriation and enriched for cells in either G1 (2N DNA, top two rows) or G2/M (4N DNA, bottom two rows) were treated with 0.1 % DMSO or 100 nM vincristine (VCR) for the times indicated. Cells were fixed and stained with propidium iodide and analyzed by flow cytometry. The histograms are representative of 3 independent experiments. Inset: Average 4N DNA content and selective <2N DNA content, expressed as percentage of total cells analyzed. B, C. ALL-2 or ALL-5 cells, as indicated, in G1 phase (panel B) or G2/M phase (panel C) were treated with 100 nM vincristine (VCR) for the times indicated and extracts subjected to immunoblotting for PARP or MPM2. Intact and cleaved species of PARP are shown. Untreated or VCR-treated KB3 cells (left two lanes) served as positive control. GAPDH was used as a loading control.
