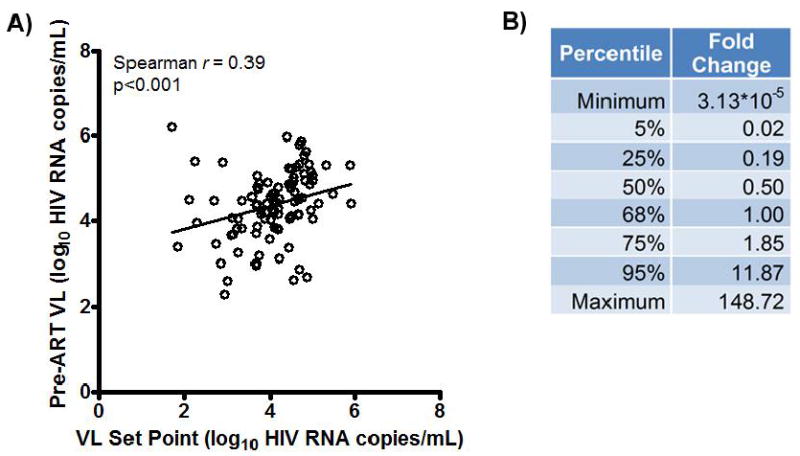
Figure 2. Relationship of pre-ART Viral Load and Post-ATI Set Point.

A) Plot of pre-ART VL vs. set point for 95 chronically infected patients for whom data were available. B) Percentile data for fold change of ATI VL Set Point to Pre-ART VL (non log10 transformed). Fold change represents post-ATI set point divided by pre-ART viral load.
