
Extended Data Figure 1. Glutamate release is organized into orientation maps.
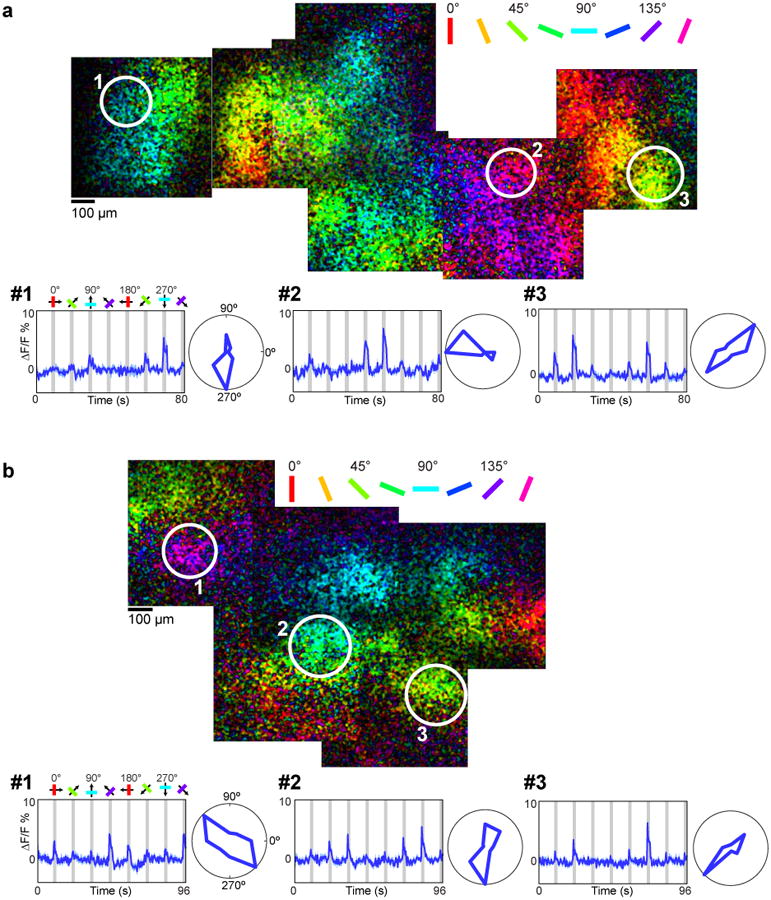
a, Region of cat visual cortex labeled with iGluSnFR. Pixels are color-coded by preferred orientation with the brightness indicating the response strength. Time courses and polar plots (averages of four trials) are shown for three regions of tissue with different orientation preferences. b, Orientation maps of iGluSnFR responses from a different cat. Time courses and polar plots are averages of 10 trials.