
Extended Data Figure 10. Orientation selective responses in Layer 1 neurons and synapses.
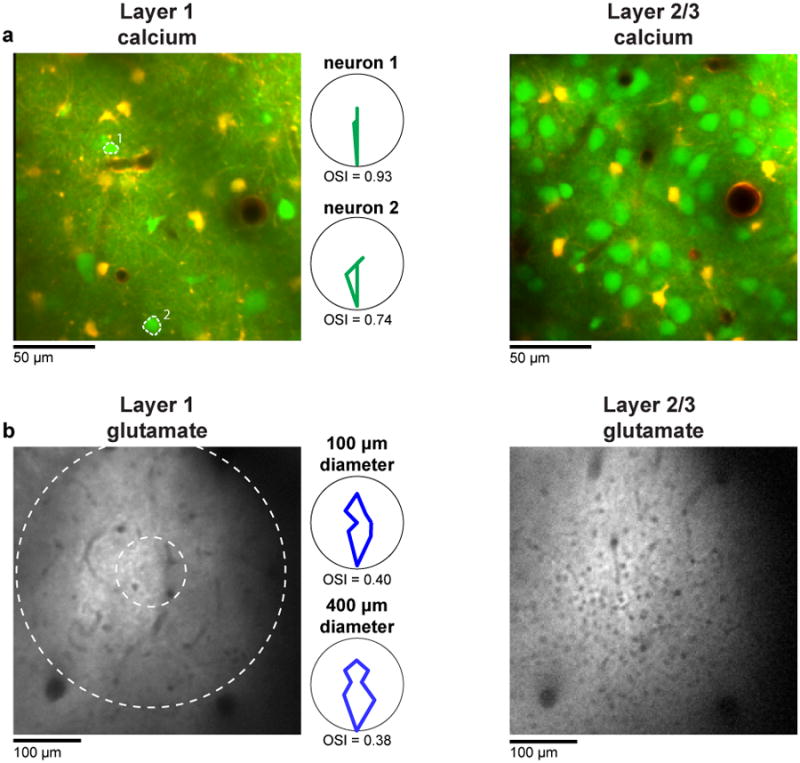
a, Region of cat visual cortex labeled with OGB 1-AM (to measure spiking activity) and SR101 (to distinguish astrocytes). Note the much sparser density of neuronal cell bodies in layer 1 (left) compared with deeper in layer 2/3 (right). The polar plots are the responses of the two layer 1 neurons labeled in the image. b, Region of cat visual cortex labeled with iGluSnFR (to measure synaptic activity). Again the density of cell bodies (the small black holes) in layer 1 (left) is much lower than in layer 2/3 (right). The polar plots are the responses of a 400-μm and 100-μm-diameter window of layer 1 glutamate activity.