
Extended Data Figure 8. Dilation measurements in small arterioles and comparison of dilation measurement techniques.
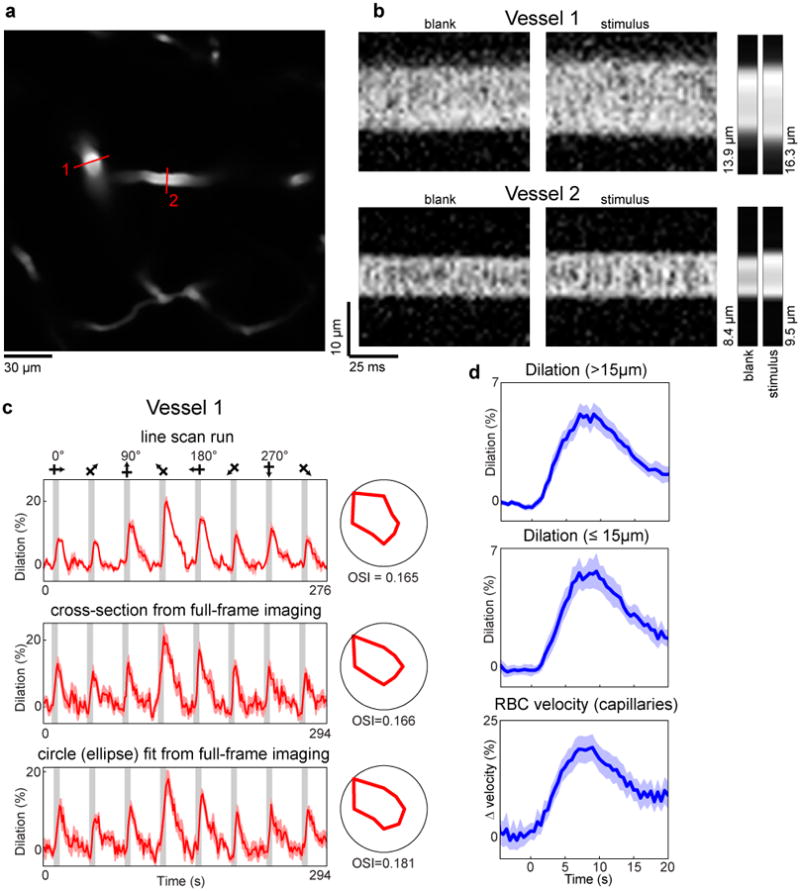
a, A penetrating artery (#1, whose responses are shown in the upper panel of Fig. 1b) and its daughter branch (#2) in cat layer 2/3 labeled with Texas-red dextran. Red lines indicate the position of the laser scan path across the vessels for line-scan diameter measurements. b, Individual line-scans are stacked next to each other to create X-Time (XT) images. The four large rectangular panels are XT images of a blank and stimulus frame for each of two vessels shown in panel a. The small panels to the right are the average across the image (∼ 0.96 seconds) for each of the four frames. The computed diameter values are also shown. These images were oversampled by interpolating between pixels (by 5 times for vessel 1 and by 20 times for vessel 2) before the diameter was calculated. c, The time courses and polar plots of the responses for three different diameter measurements are shown for vessel 1—as a line-scan, a cross-section from a full-frame imaging run (seven trials), and the circle fit from the full-frame imaging run. In this particular example we used an ellipse rather than a circle because of the elongation of the vessel due to its diving obliquely to the imaging plane. d, Time courses of the vessel responses to preferred stimulus orientations for the three groups of vessels shown in Extended Data Fig. 4b. The responses for each vessel were aligned by stimulus onset and binned in 400 ms bins. The population average was then smoothed with a three frame running average. Mean responses in dark colors and light bands indicate s.e.m. Note that the similar error bands and temporal profiles indicate that the smallest vessels had similar quality of responses to the larger ones.