
Extended Data Figure 9. Comparison of orientation selectivity in regions of calcium responses with and without neuropil.
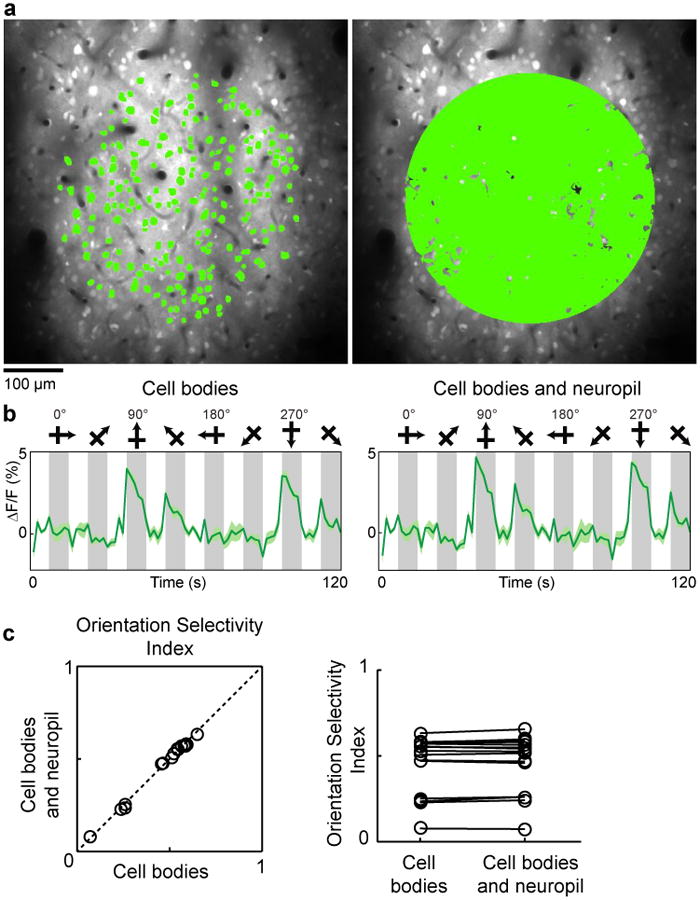
a, In vivo anatomical image of cells labeled with OGB-1 AM in cat visual cortex and selection of two different masks for quantitative analysis of orientation selectivity. Left panel: A 400-μm-diameter mask comprising soma pixels only. Right panel: A 400-μm-diameter mask comprising all significantly responding pixels (see Methods). b, The time courses of calcium responses computed from the two masks. Time courses are averages of five trials, error bands represent s.e.m. and gray bars represent the periods of visual stimulation. c, For a population of 16 imaged regions (from 7 cats), the orientation selectivity index (OSI) was computed with the two masks and found to be indistinguishable (cell bodies only OSI mean ± s.e.m. = 0.46 ± 0.04; cell bodies and neuropil OSI mean ± s.e.m. = 0.47 ± 0.04; P = 0.12; paired t-test).