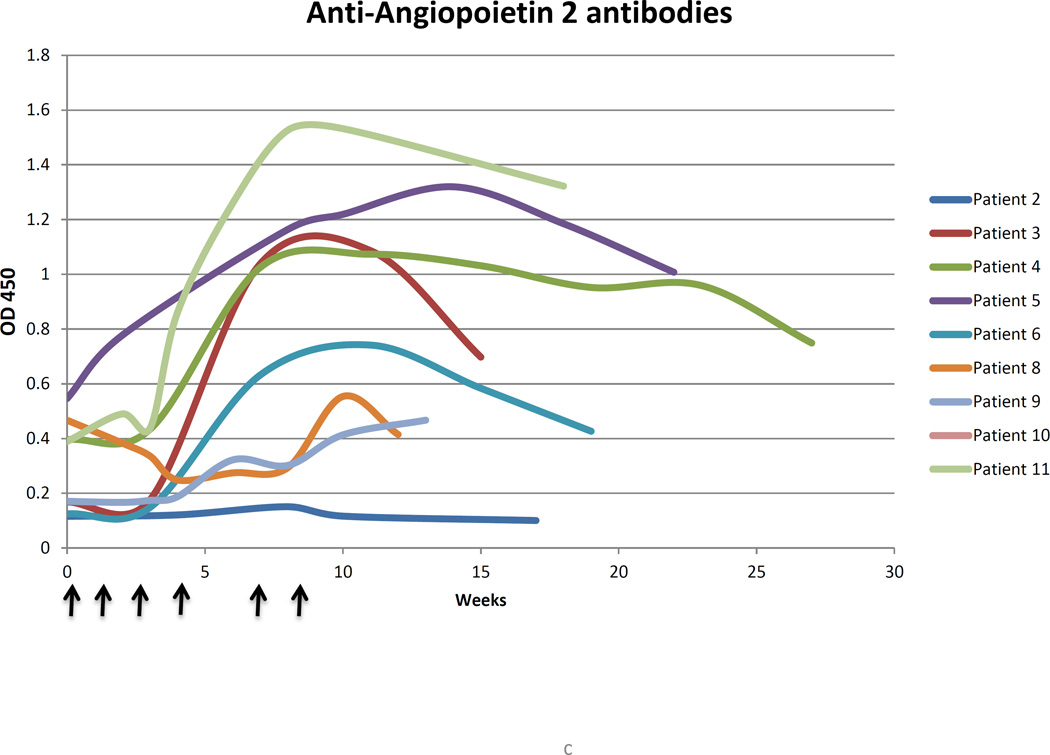
Figure 1.
(A) Measured absorbance of patient plasma in ELISA assay against angiopoietins 1 (Ang1) and 2 (Ang2) vs. week from the time of initial vaccination in patients with recurrent malignant glioma. The blue dashed vertical lines denote the timepoint of the last dose of vaccine per patient.
The aggregate time course and magnitude of anti-Ang1 antibodies (B) and anti-Ang2 antibodies (C) are represented. Vaccinated patient plasma more consistently registered responses to Ang2 peptide, and these were typically of greater intensity than responses to Ang1. Arrows denote delivery of vaccine.


