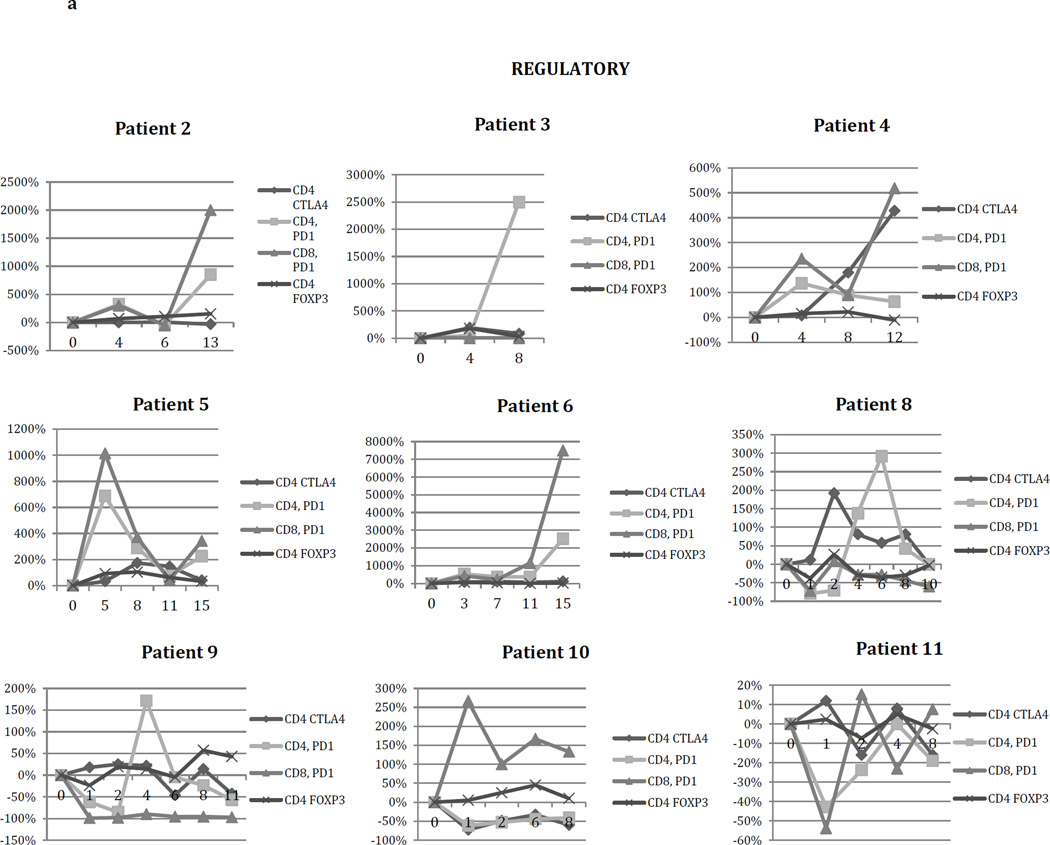
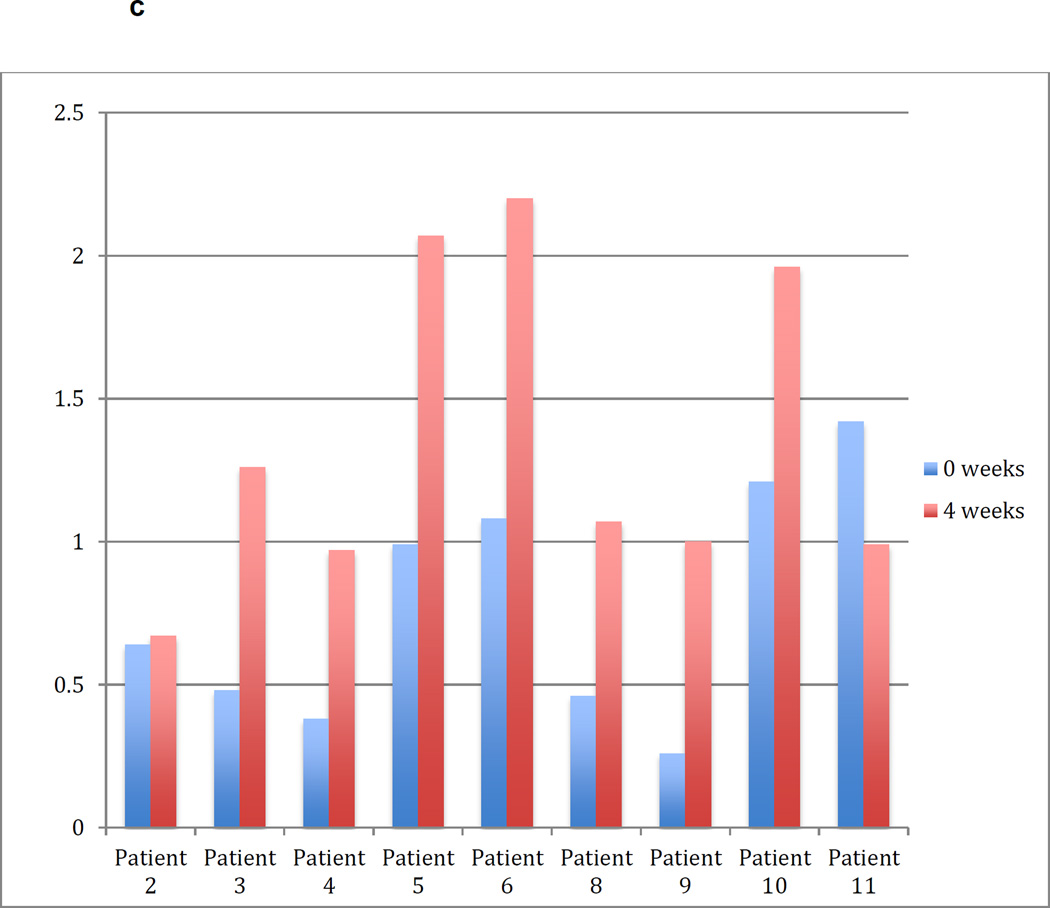
Figure 2.
Per cent change in blood lymphocyte expression of (A) negative regulatory co-stimulatory molecules and FoxP3 (CD4+) and of (B) costimulatory molecules associated with immune intensification vs. weeks after first treatment in vaccinated patients with recurrent malignant glioma. Maximal changes in costimulatory molecule expression varied in timing and significance. X-axes reflect weeks after initiation of therapy.
(C) Frequency of CD4+CD25+CD127- T lymphocytes at the initiation of vaccination (week 0) and 4 weeks later. (D) Percent change in the frequency of CD4+CD25+CD127- T lymphocytes between weeks 0 and 4 of treatment. Red color reflects percentage decrease.


