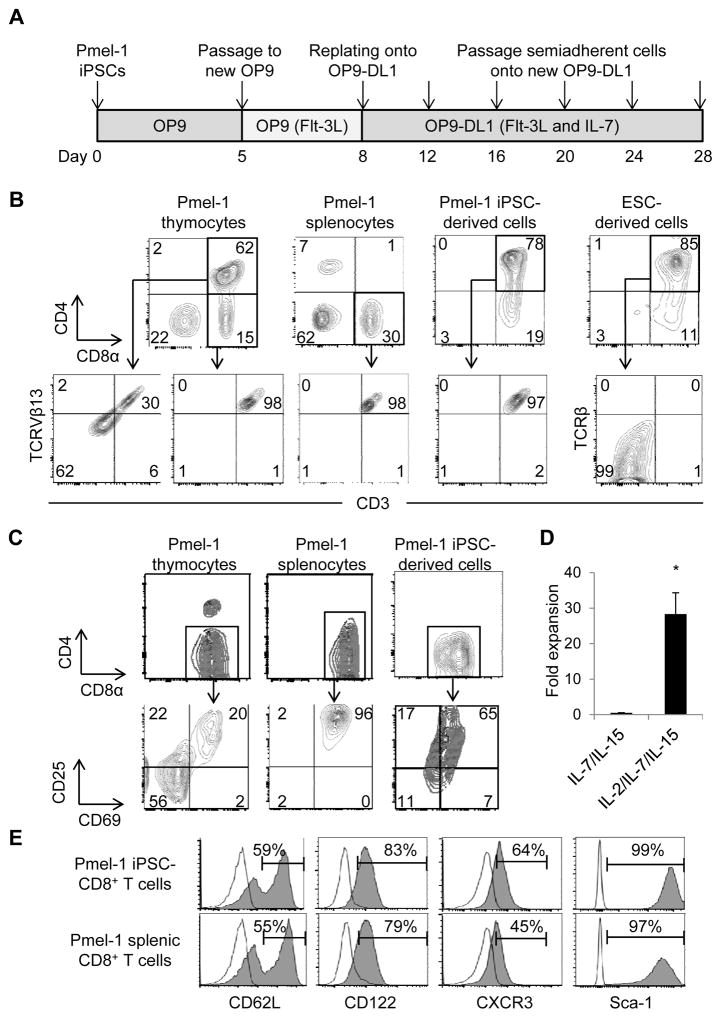
Figure 3. Generation of less-differentiated CD8+ T Cells from Pmel-1 iPSCs for adoptive cell therapy.
(A) Schematic illustration showing the regeneration of T cells from Pmel-1 iPSCs. (B) Phenotypic analysis of Pmel-1 iPSC-derived cells and mESCs on OP9-DL1 cells on day 20. Pmel-1 thymocytes and splenocytes were used for comparison. Viable lymphocytes were analyzed for CD4 and CD8α surface expression (upper), and CD4 CD8 DP or CD8 SP cells were further analyzed for CD3 and TCRVβ13 or TCRβ surface expression (lower). Data are representative of 5 independent experiments. (C) Phenotypic analysis of Pmel-1 iPSC-derived DP T cells, thymocytes and splenocytes 2 days after activation with hgp100 in the presence of IL-7 and IL-15. Viable lymphocytes were gated on CD8α and analyzed for CD25 and CD69 surface expression. Data are representative of 2 independent experiments. Numbers in (B) and (C) indicate the percentage of cells showing in each quadrant. (D) Fold expansion of Pmel-1 iPSC-derived T cells with IL-7 and IL-15 versus IL-2, IL-7 and IL-15 during expansion from day 2 to day 6. (*=P < 0.01 by 2-tailed unpaired Student’s t test) (E) Phenotypic analysis of Pmel-1 iPSC-derived and splenic CD8+ T cells after 2-day activation with hgp100 in the presence of IL-7 and IL-15 followed by 4-day expansion with IL-2, IL-7 and IL-15. Viable lymphocytes were gated on CD8α and analyzed for CD62L, CD122, CXCR3 and Sca-1 surface expression. Open histograms indicate the isotype-control staining. Data are representative of 3 independent experiments.

