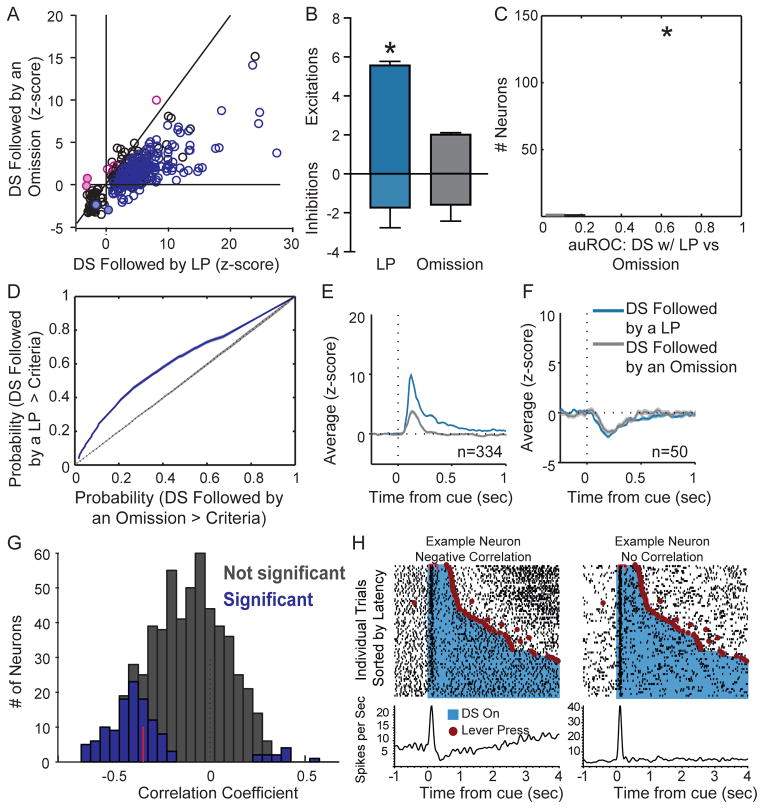
Figure 3. VP neuron excitations to the DS depend on whether the DS is followed by a lever press, and on the subsequent latency to respond.
A, Scatterplot of normalized (as z-score) responses to the DS when it is followed by a response versus when it is not, showing neurons that are significantly more excited when the DS is followed by a response (purple) than when it is not (pink). B, Average (+SEM) modulation after the DS is stronger for excited neurons (top) when the animal makes a subsequent lever press, but not for inhibited neurons (bottom). C, Histogram of auROCs, for the analysis of DS-related firing on trials with and without a lever press; the population average is indicated in red, and the dotted line shows the average control auROC (* = p<0.001). D, Average ROC curve for the whole population for the DS with lever press versus omission analysis (purple line; shading depicts standard error) and the control analysis (dotted black line). Average responses to the DS with a response (blue) and without (grey), split into neurons that are significanlty excited by the DS (E, left, n = 334), and those that are inhibited by the DS (F, right, n = 50). Only sessions in which at least 10 DS presentations were not followed by a response were included in this analysis. G, Distribution of Spearman rank correlation coefficients relating firing (0 – 300 ms after DS onset) to the animal’s latency to press the lever on a trial-by-trial basis. Bars shaded in dark grey show neurons with significant correlations, red line shows median correlation coefficient of the significant neurons. H, Example DS-excited neurons with either a significant negative correlation between firing rate and latency (left) or no significant correlation (right). Individual trials are sorted by latency between the onset of the DS (blue) the time of the lever press (red circle). Rasters and correponding histograms show firing aligned to DS onset.

