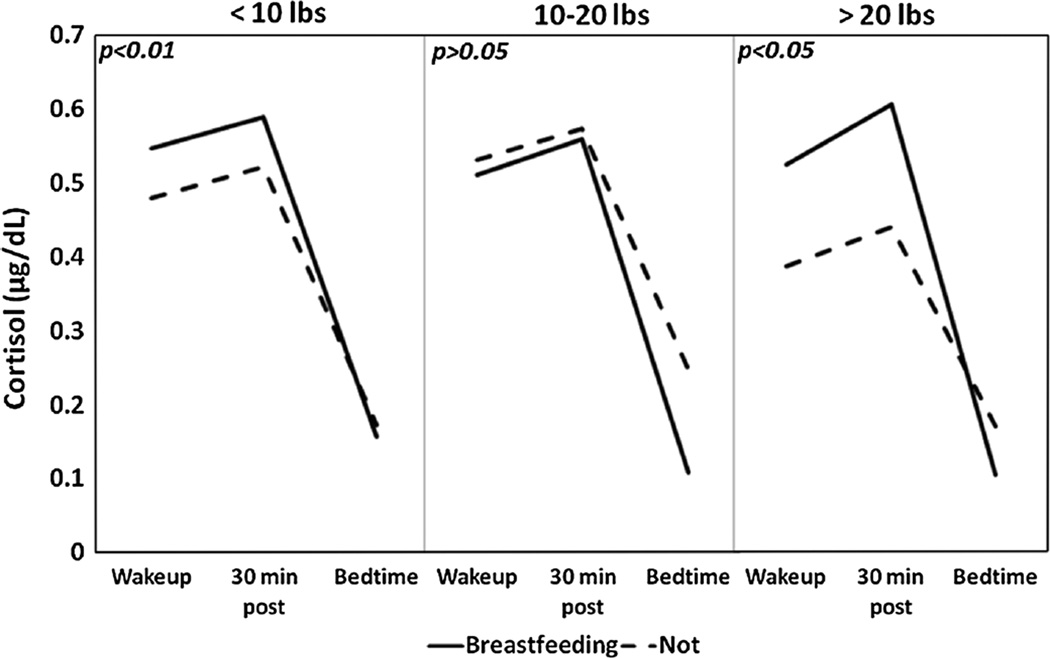
Fig. 2.
For each weight retention category (<10, 10–20 and >20 lbs) the average cortisol slope is displayed by breastfeeding status at 6 months. p values are reported in the upper left corner of the respective graphs. Women who breastfed at 6 months in the <10 and >20 lbs categories had significantly steeper slopes than women who were not breastfeeding (p < 0.01 and p < 0.05 respectively)

