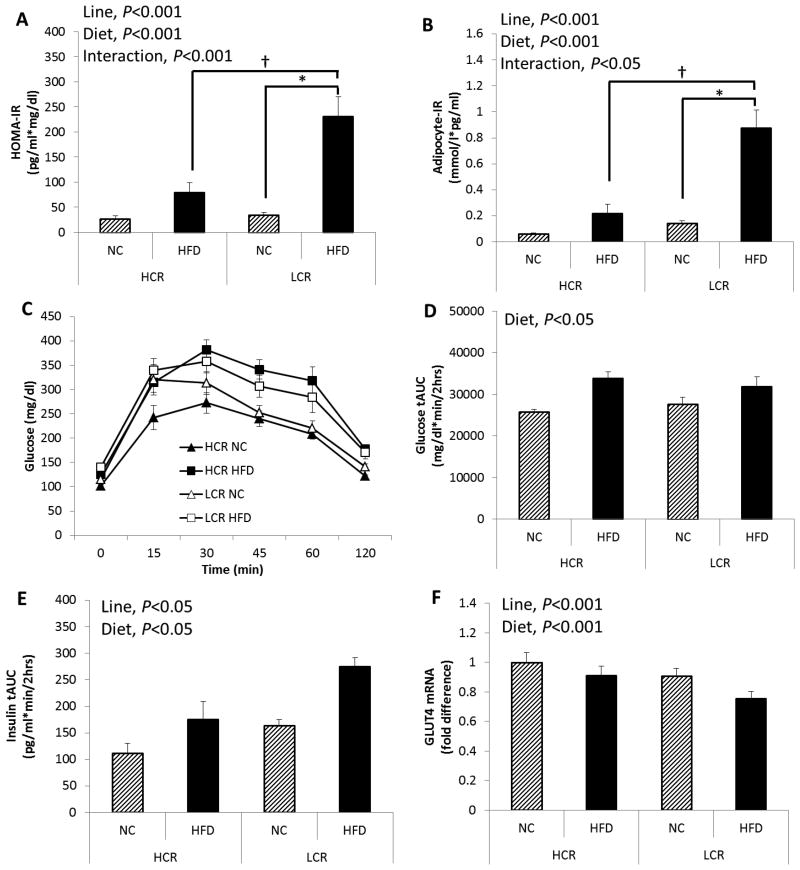
Figure 3. Despite similar weight gain on HFD, HCR are partially protected against HFD-induced insulin resistance.
(A) HOMA-IR, (B) adipocyte-IR, (C) plasma glucose levels during a 2-hour intraperitoneal glucose tolerance test (GTT), (D) glucose tAUC during GTT, (E) Insulin secretion during GTT indicated as insulin tAUC, and (F) skeletal muscle glucose transporter type 4 (GLUT4) mRNA expression. Values are means ± SE (n=5-6 per group). Line = line main effect, HCR vs. LCR; Diet = diet main effect, NC vs. HFD; Interaction = line × diet interaction. * Denotes difference (P<0.05) between NC and HFD within line. † Denotes difference (P<0.05) between HCR HFD and LCR HFD.

