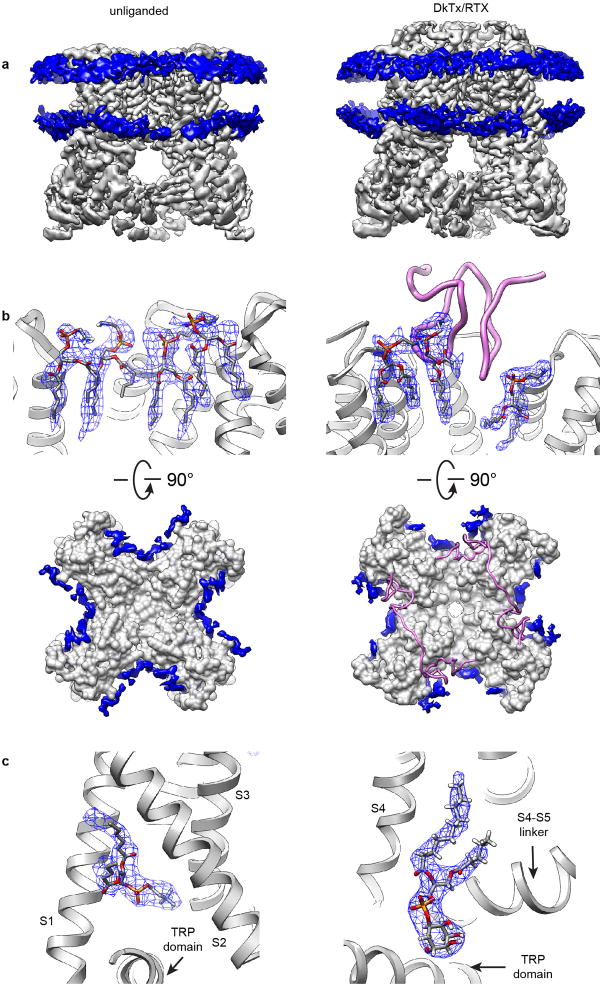
Extended Data Figure 7. Categories of lipid densities observed in TRPV1 structures.
a, Two continuous layers of density (blue) contributed by lipid head groups of bilayer within nanodisc are shown for apo channel (left) and channel in complex with RTX/DkTx (right). b, Atomic model of annular lipids could be built into well resolved densities (blue mesh) surrounding the channel protein. DkTx is shown as ribbon diagram (pink). Top-down views show distribution of resolved annular lipids (blue) in inter-subunit crevices at the outer leaflet of the membrane. c, Well-resolved densities (blue mesh) in the structures representing a phosphatidylcholine molecule (left) and a phosphatidylinositol molecule (right). Transmembrane helices of TRPV1 close to the binding site are also shown as ribbon diagrams (grey).

