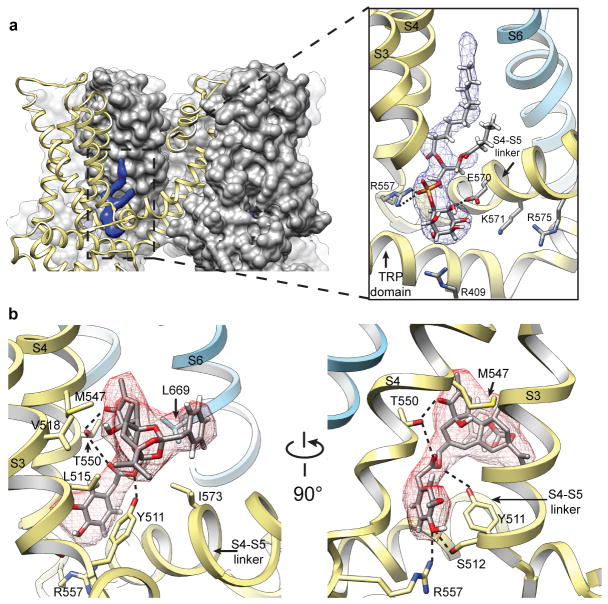
Figure 4. Shared binding pocket for phosphatidylinositol lipids and vanilloid ligands.
a, Surface representation of TRPV1 (grey) in cutaway view revealing location of bound co-factor (blue). Superimposed ribbon diagram (yellow) denotes location of transmembrane α-helices for one channel subunit. Detailed view of boxed region shows how co-factor density (blue mesh) accommodates a molecule of phosphatidylinositol (PI). Positive and negative side chains from S4 and S4–S5 linker, respectively, can form ionic interactions with negatively charged phosphate or hydroxyl moieties on inositol ring. Helices from a neighboring subunit (light blue) are also shown. b, Density for resiniferatoxin (RTX, red mesh) is well fit by its atomic structure. Residues essential for RTX sensitivity (Y511, M547, T550) lie in close proximity to the ligand and can engage in electrostatic or hydrophobic interactions. Densities for PI and RTX define overlapping, but non-identical sites (also see Extended Data Fig. 9).

