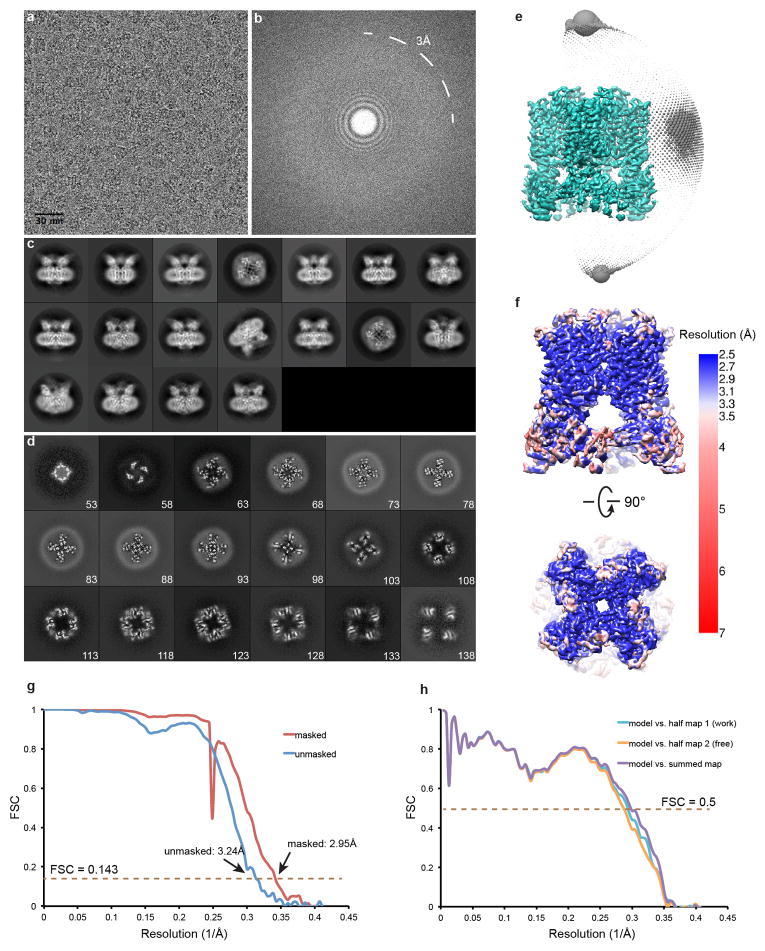
Extended Data Figure 3. Single-particle cryo-EM studies of agonist-bound TRPV1 in lipid nanodisc.
a, Representative raw micrograph of TRPV1-RTX/DkTx in nanodisc. b, Fourier transform of image in (a). c, Gallery of 2D class averages. d, Slices through the unsharpened density map at different levels along the channel symmetry axis (numbers start from extracellular side). e, Euler angle distribution of all particles included in the calculation of the final 3D reconstruction. Position of each sphere (grey) relative to the density map (green) represents its angle assignment and the radius of the sphere is proportional to the amount of particles in this specific orientation. f, Final 3D density map colored with local resolution in side and top views. g, FSC curves between two independently refined half maps before (blue) and after (red) the post-processing in RELION. h, FSC curves for cross validation: model versus summed map (purple), model versus half map 1 (used in test refinement, cyan), model versus half map 2 (not used in test refinement, orange). Small differences between the “work” and the “free” curves indicate little effect of over-fitting.

