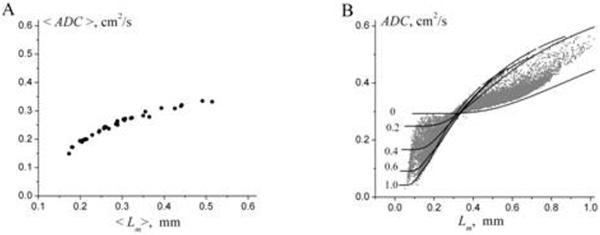
Figure 21.
ADC vs Lm found in for 30 subjects from study (6). (A) The average (over each subject) values of the parameters ADC and Lm. (B) ADC and Lm calculated on a pixel-by-pixel basis (grey symbols). The lines represent the dependence of ADC as a function of Lm, theoretically calculated at fixed values of the ratio h/R (given by numbers near the lines). Importantly, each value of Lm can be associated with numerous values of ADC, and vice versa.

