
Figure 3.
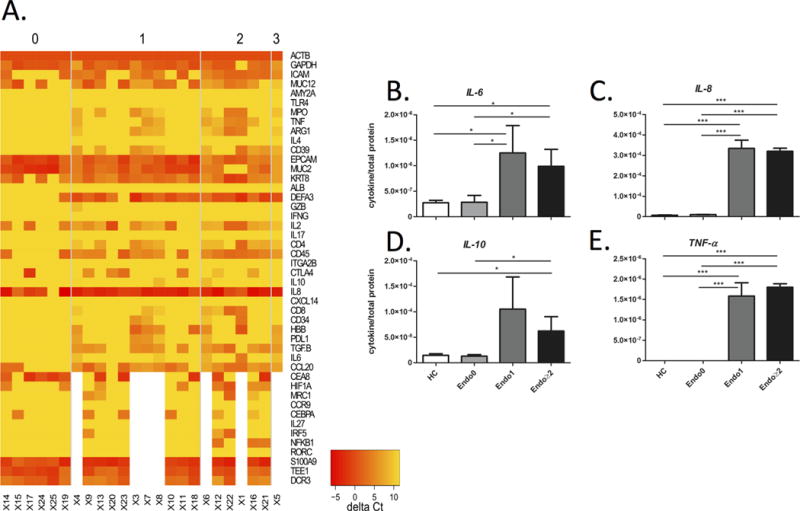
Levels of mRNA and cytokine proteins in lysed EVs from patients grouped according to Mayo endoscopic score. (A) Heatmap of normalized mRNA data was compared among Mayo score 0, 1, 2 and 3; yellow and red indicates lower expression and higher expression, respectively. (B–E) Each graph represents the mean cytokine level, normalized to its total protein concentration, as measured by ELISA in colonic EV samples from healthy controls (HC, N=3), and IBD patients with Mayo endoscopic scores of 0 (N=12), 1 (N=12), and ≥2 (N=12). Note that error bars are standard deviations.