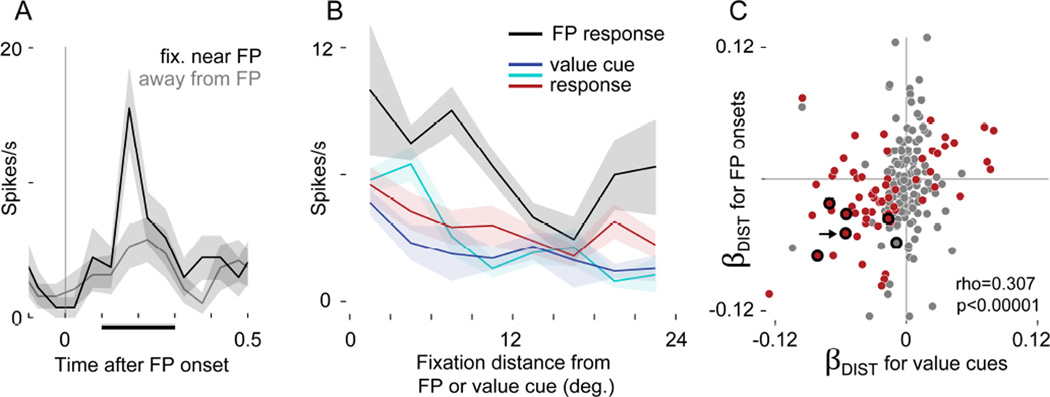
FIGURE 6. Gaze distance modulates firing evoked by fixation point onset.
(A) Firing in an identified single unit time-locked to the onset of the fixation point (FP). Black shows when gaze was near the FP at onset (<5 deg.), and gray shows when gaze was away (>15 deg.). Firing was measured in a 200ms window (black bar on x-axis) to generate the black line in B. (B) Same cell as A. Firing as a function of distance of gaze from the FP (black) or from the value cues (colors, as in Figures 1–4). In A and B, lines show means, and shaded areas show S.E.M. (C) Comparison of gaze distance effects in the value cue data and FP-evoked responses. The x-axis gives βDIST from the value cue data (same as βDIST in Figure 5) and the y-axis gives βDIST-FP, calculated in a separate GLM using firing evoked by FP onsets. Each dot indicates a neuron, and the arrow shows the cell in A and B. A red point indicates a significant effect in the value cue data, and a thick black ring, the FP data (p<0.05 corrected for both). Overlapping red points within black rings indicate cells with significant effects of both βDIST and βDIST-FP. Because fewer observations were available in the FP data (see text) only 228 neurons had sufficient data to fit the model and calculate βDIST-FP, and very few neurons showed significant effects. The correlation statistic reflects 228 cells, but C shows only 218 due to axis limits; the correlation for the visible data points alone (n=218) is rho = 0.310, p< 1×10⁻⁵.

