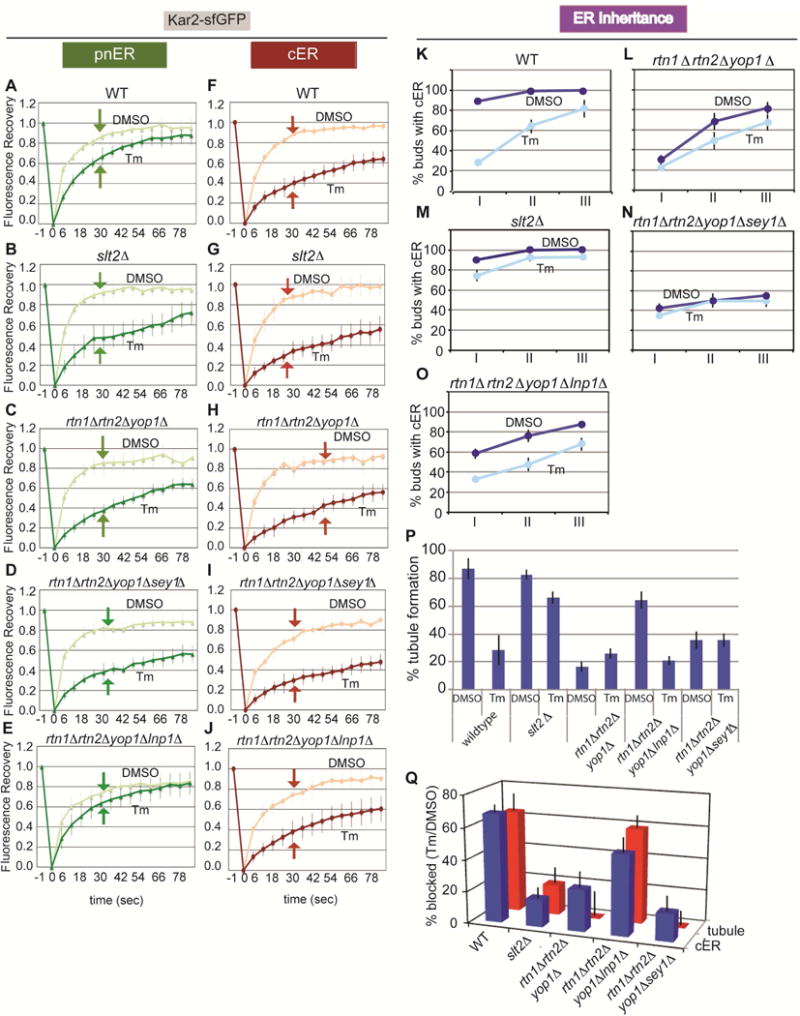
Figure 4. The ER stress response and ER inheritance are defective in rtn1Δrtn2Δyop1Δ cells and this is rescued by deletion of Lnp1.

(A–J) FRAP analysis of the pnER and cER of Kar2-sfGFP-expressing WT (A and F), slt2Δ (B and G), rtn1Δrtn2Δyop1Δ (C and H), rtn1Δrtn2Δyop1Δsey1Δ (D and I), and rtn1Δrtn2Δyop1Δlnp1Δ cells (E and J). Graphs are the mean ± SD of 3 experiments, each examining ≥7 cells.
(K–O) Quantification of cER inheritance in WT (K), rtn1Δrtn2Δyop1Δ (L), slt2Δ (M), rtn1Δrtn2Δyop1Δsey1Δ (N), and rtn1Δrtn2Δyop1Δlnp1Δ cells (O) expressing Hmg1-GFP. Cells were treated with DMSO (dark blue) or Tm (pale blue) and cER inheritance was scored as described in Figure 3I–J. Graphs show the mean ± SD of 3 experiments, each with ≥200 cells counted.
(P) Quantitation of early ER tubule formation in WT, slt2Δ, rtn1Δrtn2Δyop1Δ, rtn1Δrtn2Δyop1Δlnp1Δ, and rtn1Δrtn2Δyop1Δsey1Δ cells expressing Hmg1-GFP. Cells were treated with DMSO or Tm for 3 hr. Quantitations are the mean ± SD of 3 experiments, each analyzing ≥40 cells.
(Q) Correlation of the block in initial tubule formation [100 – 100 × (% tubule formation with Tm)/(% tubule formation with DMSO)] (Figure 4K–4O) and cER inheritance [100 – 100 × (% cER inheritance with Tm)/(% cER inheritance with DMSO)] (Figure 4P) for WT, slt2Δ, rtn1Δrtn2Δyop1Δ, rtn1Δrtn2Δyop1Δlnp1Δ, and rtn1Δrtn2Δyop1Δsey1Δ cells expressing Hmg1-GFP. The data represent the mean ± SD of 3 experiments. See also Figures S3 and S4.
