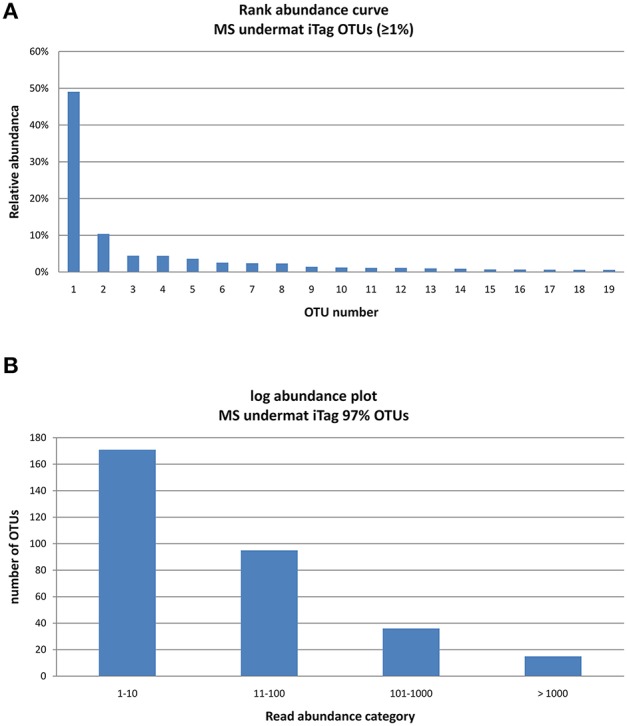
Figure 3.

Rank abundance curve of the 15 very abundant OTUs (>1,000 reads) obtained from the undermat 16S rRNA gene amplicon study (relative read counts) (A), and Log abundance plot of the all 317 OTUs obtained from the undermat 16S rRNA gene amplicon study (B). 15 OTUs (= 5%) were detected more than 1,000 times.
