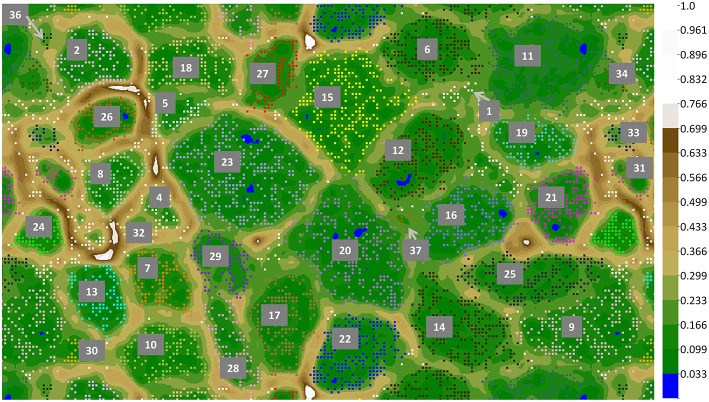
Figure 4.
ESOM binning of Mushroom Spring assembled undermat metagenome sequences >5 kb. In order to show complete bins, the map is shown in tiled mode, displaying four connected partial copies of the grid with some redundancy of data points. Repeating colors imply repeating bins. Complete bins are labeled with numbers (number code and details of the bins is found in Table 3). Additional partial copies of the bins due to the tiled display are not labeled. The color gradient code on the right visualizes relative height values; the largest height normalized to 1.

