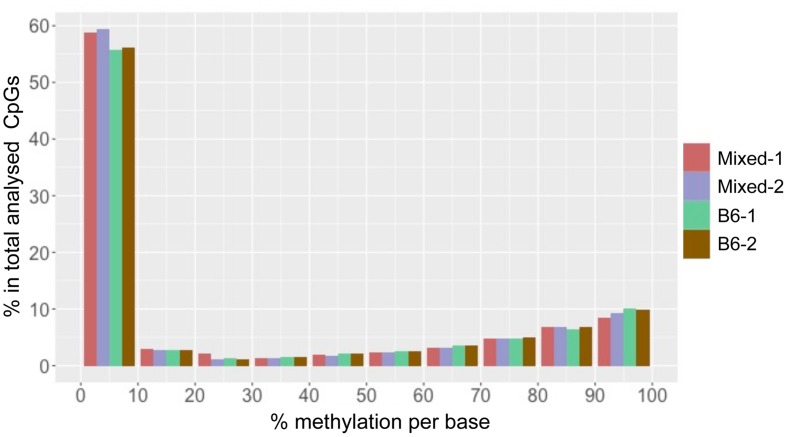
FIGURE 1.
CpG methylation patterns in mouse liver is consistent across different strains. The x-axis shows percent methylation for each CpG site. The y-axis denotes the percentage of CpGs contained in the corresponding bins. Two male mice from either a Mixed or C57BL/6J (B6) are depicted as with red, purple, green and brown, respectively.

