FIGURE 7.
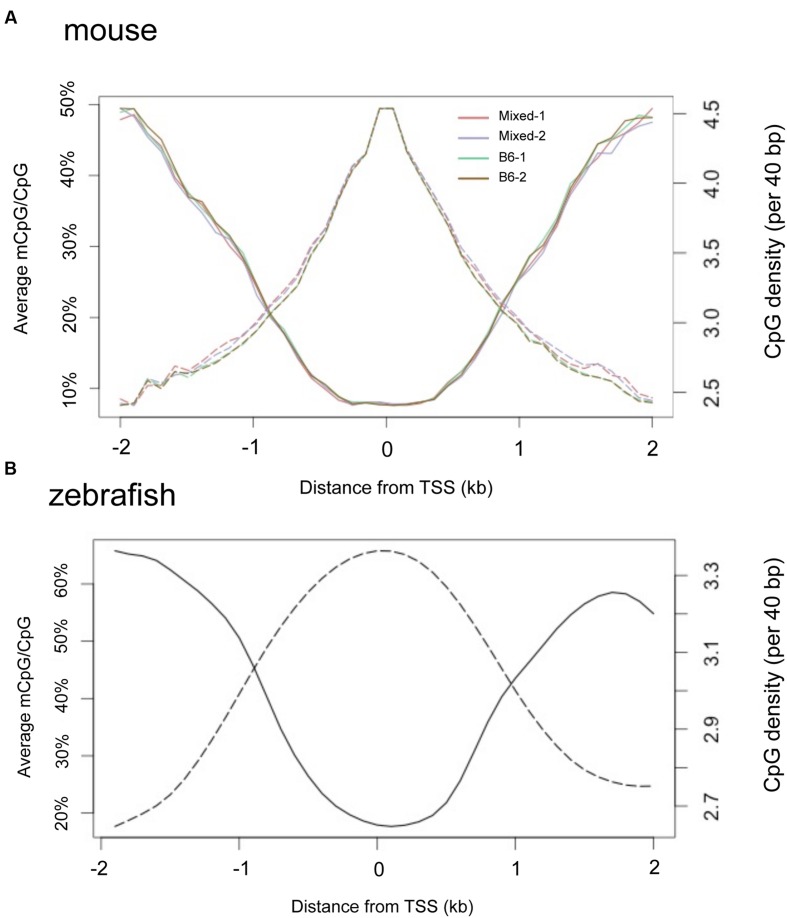
TSS regions have higher CpG density and less methylation in both mouse and zebrafish livers. Composite profiles the regions are 2 kb around TSS. Y-axis on the left denotes the average of methylated CpG, represented by a solid line. Y-axis on the right hand denotes the CpG density, represented by dashed lines. (A) Livers from four mice strains. (B) Zebrafish liver.

