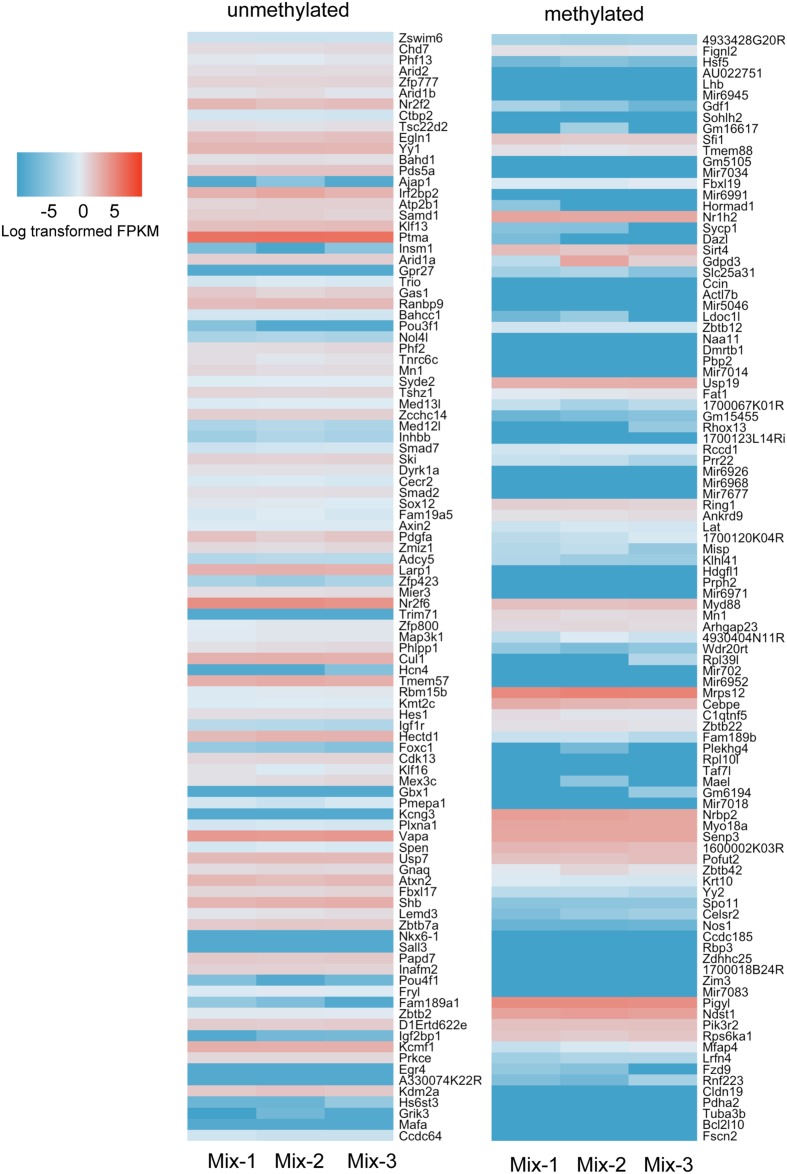
FIGURE 8.
More hypermethylated genes are expressed at lower levels than hypomethylated genes. Top 100 genes ranked in hypermethylated (>80%) and hypomethylated (<20%) gene list were plotted with expression values. The gene list was based on the counting CpG in promoter regions (5 kb upstream of TSS). Color scale was represented by the log transformed fpkm value from RNAseq.

