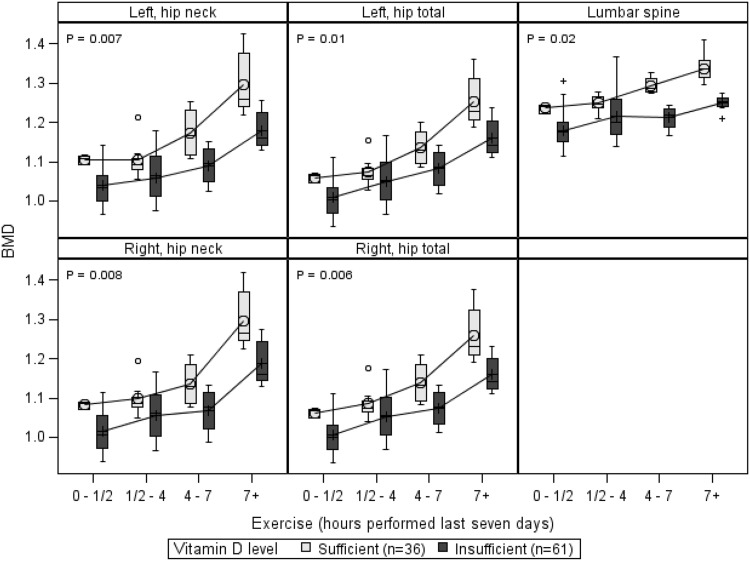
Fig. 1.
Vitamin D levels—BMD (g/cm2) and exercise (hours performed over last 7 days) by scan site, adjusted for BMI (kg/m2). p values are from main effects for vitamin D levels compared at each scan site. The box, interquartile range; horizontal line inside the box, median value; symbol (cross or circle), mean value; T-shaped caps, max. and min. values

