Fig. 4.
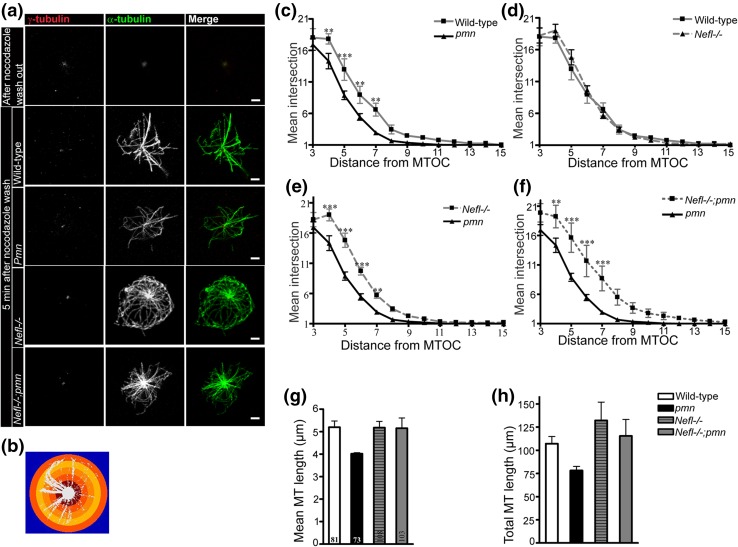
NFL depletion enhances microtubule (MT) regrowth in pmn mutant motoneurons in vitro. a Representative images of motoneurons showing depolymerized microtubules (MT) after nocodazole treatment and MT regrowth after 5 min of nocodazole washout. Microtubules (MT) are labeled using α-tubulin (green) and centrosome by γ-tubulin (red). Bars 2 µm. b Representative image of Sholl analysis performed to count the number of MTs with 1 µm concentric circles step. c–f Number of MT intersections (y axis) at increasing distance (x axis) from microtubule organizing center (MTOC) was counted. Line graphs showing mean ± SEM (two-way ANOVA with Bonferroni’s post hoc test, n = 4 independent experiments, **P < 0.01, ***P < 0.001). g Average length of MTs from each MTOC is plotted. h Total length of MTs regrown from each MTOC is plotted. Bars represent mean ± SEM

