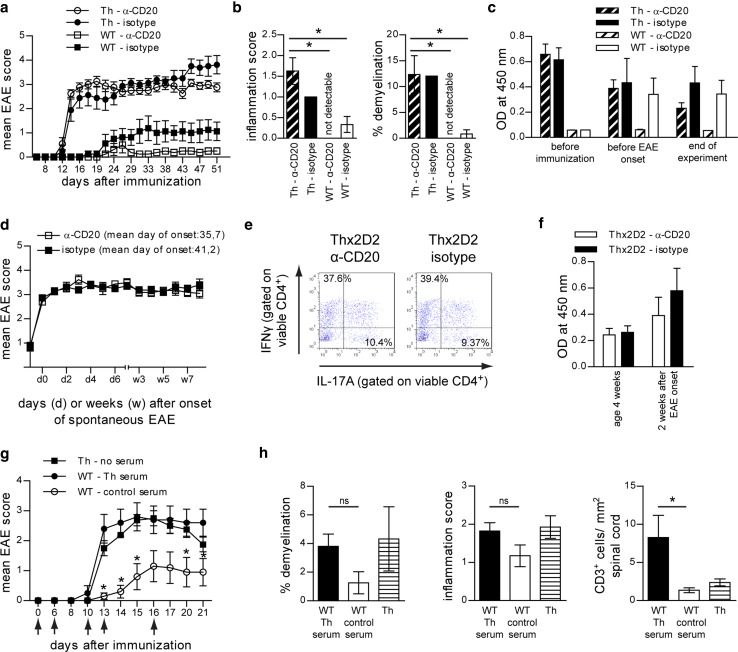
Fig. 1.
B cells are not required for fulminant induced EAE in Th mice nor for spontaneous EAE in Thx2D2. a–c Th or WT mice were treated weekly with anti (α)-CD20 or isotype control Ab starting 3 weeks prior to immunization with mMOG. a Mean group EAE score ± SEM; n = 10 mice/group; * = p < 0.05 (Mann–Whitney; data represent five independent experiments). b CNS inflammatory damage at day 48 after immunization. Indicated is the mean group score ± SEM of spinal cord inflammation (H&E; left), determined as: 0 = no inflammation, 1 = slight inflammation. 2 = moderate inflammation, 3 = strong inflammation and the mean % ± SEM of demyelinated spinal cord area per group (LFB/PAS; right); n = 3–4 mice/group; * = p < 0.05 (Mann–Whitney). c Anti-mMOG IgG Ab serum levels determined by ELISA (dilution 1:40,500); n = 10 mice/group. d–f Thx2D2 mice were treated weekly with anti (α)-CD20 or isotype control Ab starting 28 days after birth. d Mean group score and mean day of onset of spontaneous EAE in anti (α)-CD20 (n = 18) and isotype Ab treated mice (n = 22) ± SEM; p = ns (Mann–Whitney). e Frequency of IFN-γ and IL-17A producing T cells isolated from the CNS at the end of experiment. f Anti-mMOG IgG Ab determined by ELISA (serum dilution 1:13,500); n = 6–16 mice/group. g, h EAE was induced in WT mice by immunization with MOG p35-55. Arrows indicate i.v. injections of serum containing pathogenic anti-mMOG Ab (Th serum) or non-pathogenic Ab (control serum). Immunized Th mice not receiving any serum, served as positive control. g Mean group EAE score ± SEM; n = 8–10 mice/group; * = p < 0.05 (WT Th serum recipients vs. WT control; Mann–Whitney; data represent three independent experiments). h CNS inflammatory damage at day 25 after immunization. Indicated is the mean % ± SEM of demyelinated spinal cord white matter area per group (LFB/PAS; left), the mean group score ± SEM of inflammation (H&E; middle), determined as follows: 0 = no inflammation, 1 = slight inflammation. 2 = moderate inflammation, 3 = strong inflammation and the number of T cells/mm2 spinal cord ± SEM per group determined by CD3+ immunostaining (right); n = 4 mice/group; * = p < 0.05 (Mann–Whitney)

