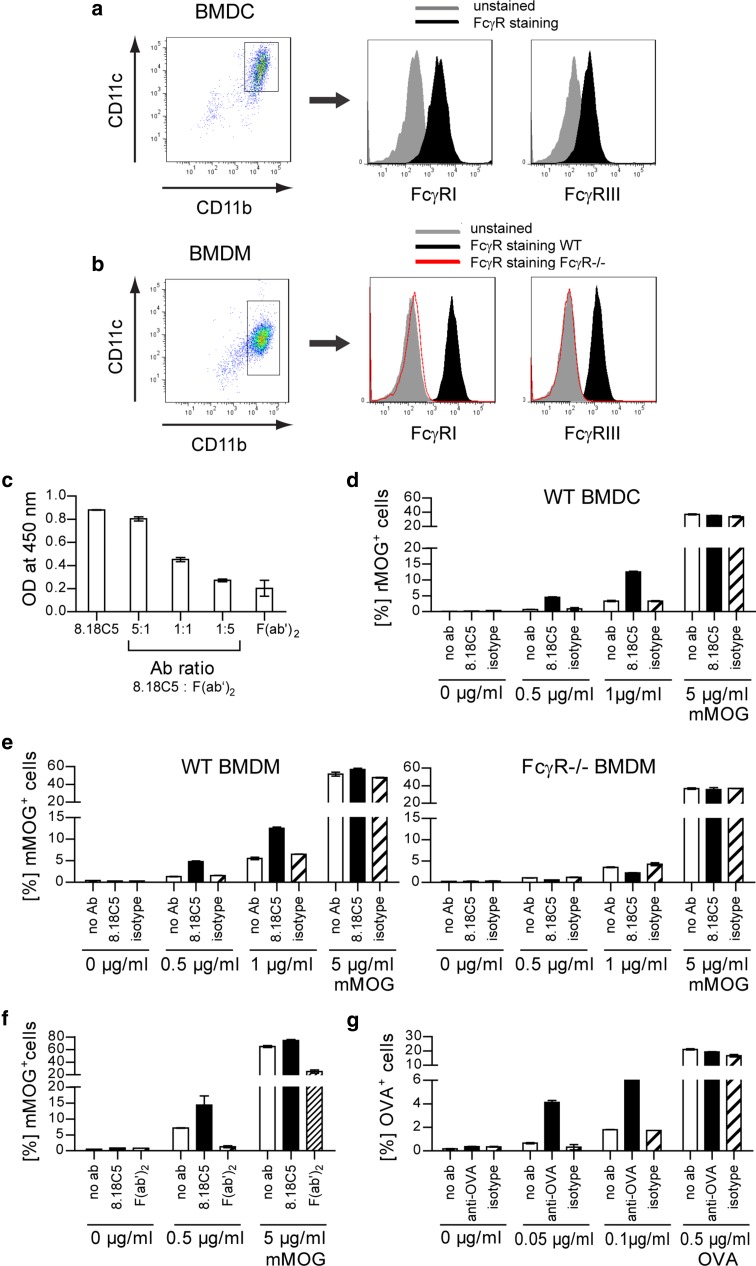
Fig. 4.
Opsonization of conformational mMOG by anti-mMOG Ab fosters Fc-mediated antigen uptake. Mean expression of Fcγ receptor (FcγR)I and FcγRIII by a WT BMDC and b WT or FcγR−/− BMDM. c Competitive binding of 8.18C5 F(ab′)2 and intact 8.18C5 Ab at various ratios to mMOG; plate-bound Ab detected by anti-mouse IgG Ab against the Fc part. d–f Phagocytosis of mMOG-DyLight-405 by APC. APC were incubated with mMOG-DyLight-405 in the presence of 8.18C5, or isotype control Ab (mean % of mMOG-DyLight-405 positive (mMOG+) APC ± SEM, gated on intact CD11b+/CD11c+ cells). d Phagocytosis of mMOG by WT BMDC. Representative data set shown; combined statistical analysis of two independent experiments: p < 0.05 for 8.18C5 vs. isotype Ab at 0.5 and 1 μg/ml mMOG (t test). e Phagocytosis of mMOG by WT (left) or FcγR−/− (right) BMDM. Representative data set shown; combined statistical analysis of two independent experiments: p < 0.05 for 8.18C5 vs. isotype control Ab at 0.5, 1 and 5 μg/ml mMOG of WT BMDM (t test). f Phagocytosis of mMOG by WT BMDM, additionally in the presence of 8.18C5 F(ab′)2 fragments. Representative data set shown; combined statistical analysis of two independent experiments: p < 0.05 for 8.18C5 Ab vs. 8.18C5 F(ab′)2 at 0.5 and 5 μg/ml mMOG (t test). g Phagocytosis of OVA-FITC by BMDM. BMDM were incubated with OVA-FITC in the presence of anti-OVA Ab or isotype control Ab (mean % of OVA-FITC positive (OVA+) BMDM, gated on intact CD11b+/CD11c+ cells). Representative data set shown; combined statistical analysis of two independent experiments: p < 0.05 for anti-OVA vs. isotype control Ab at 0.05 and 0.1 μg/ml OVA (t test)

