
FIGURE 5.
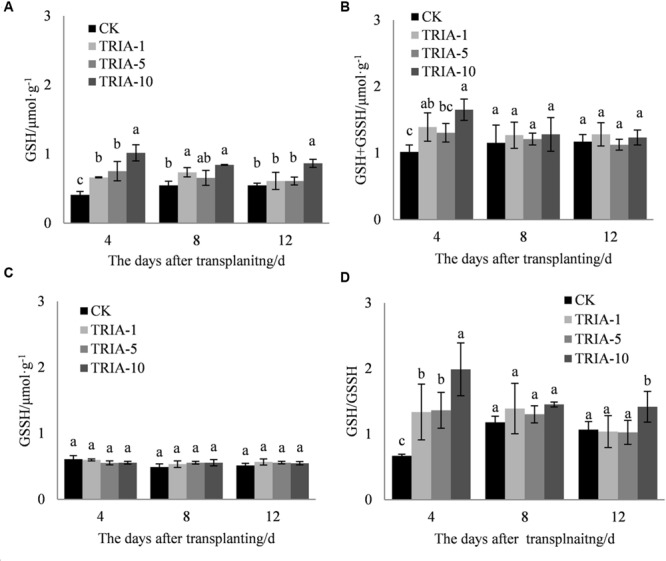
Effects of different concentrations of TRIA on GSH (A), GSSH+GSH (B), and GSSH (C) and the GSH/GSSH ratio (D) after transplanting. CK: 0 μM; TRIA-1: 1 μM; TRIA-5: 5 μM; TRIA-10: 10 μM. Segments represent the ± SEM (n = 3). Means followed by different letters indicate statistically significant differences (LSD, P < 0.05).