Figure 2.
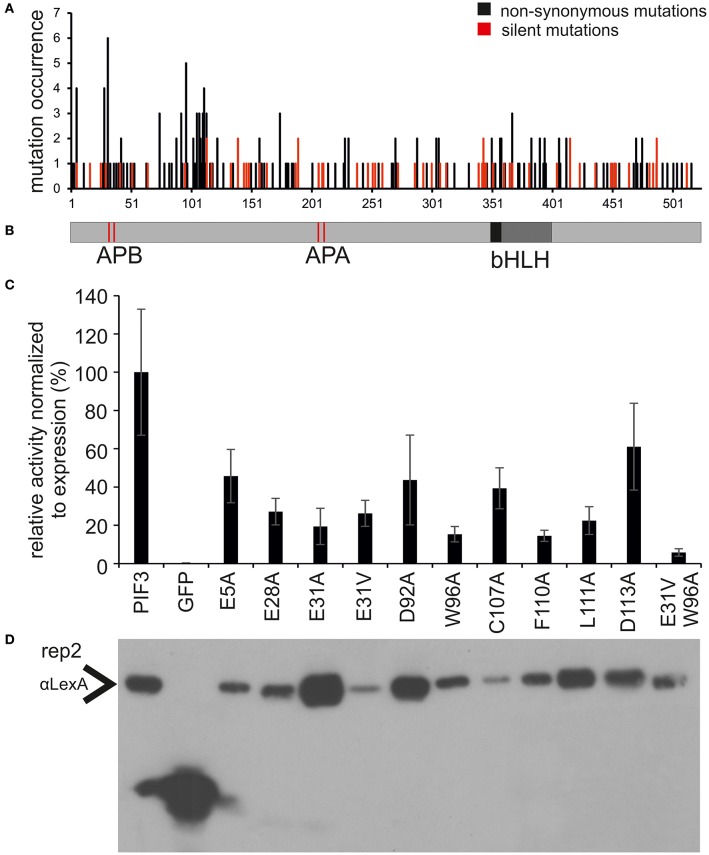
Identification and characterization of transcriptionally impaired PIF3 variants. (A) Distribution of mutations affecting transcriptional activity across the PIF3 protein shown underneath in panel (B). Shown in black are the mutations leading to a non-synonomous amino acid substitution, while silent mutations are marked in red. The frequency of non-synonomous mutations is strongly increased in two discrete regions in the PIF3 N-terminal region. (B) Schematic representation of the PIF3 protein sequence and its known features to scale with the sequence length in panel (A). (C) Relative Miller unit (M.U.) activity of single amino acid substitutions in PIF3 as determined by quantitative b-Gal assay and normalized to protein expression by quantitative Western blot analysis. Measurements represent the mean value of three biological and two technical replicas each. Standard error of the mean is indicated by error bars. All residues selected in this analysis were identified in the screen by high mutation occurrence. Amino acids are indicated in standard single letter code: first letter gives the original aa identity, number gives the position in the protein sequence, last letter gives the mutant aa residue. (D) The Western blot corresponds to replica 2 in Supplementary Figure 1, which depicts the raw data for normalization of the activity levels.

