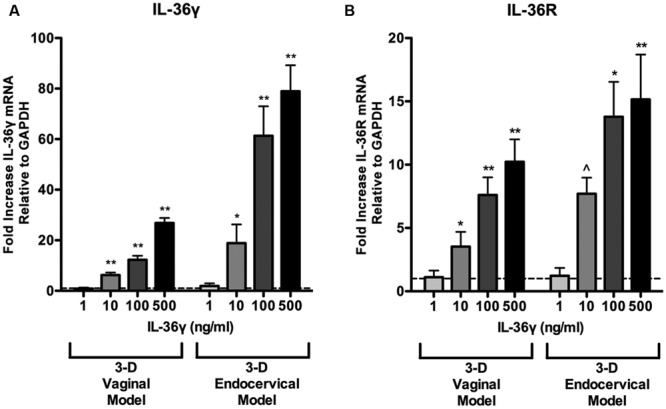
FIGURE 4.

Induction of IL-36γ and IL-36R expression following recombinant IL-36γ treatment. 3-D vaginal and endocervical EC were treated with increasing doses of recombinant IL-36γ (1, 10, 100, and 500 ng/ml) for 24 h. (A) IL-36γ and (B) IL-36R expression was determined by qRT-PCR and reported relative to GAPDH as fold change compared to PBS treated samples. Horizontal dashed line indicates IL-36γ expression in PBS treated cells. Data are shown as mean ± SD from three independent experiments each performed in duplicate. ˆP < 0.05; ∗P < 0.01; ∗∗P < 0.001; unpaired two-tailed Student t-test with Welch’s correction.
