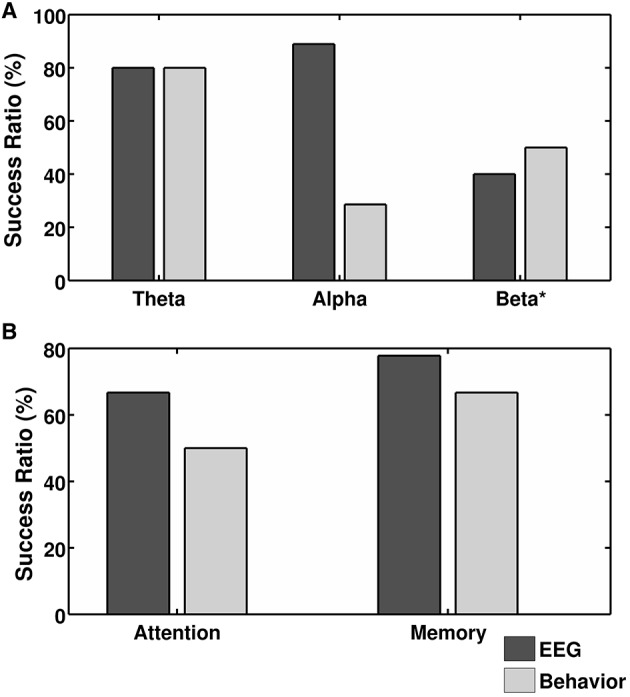
Figure 2.

Success ratio of the spectral EEG changes (dark gray bars) and behavioral improvement (light gray bars) calculated for: (A) experiments grouped according to training with particular frequency band protocols and (B) training aimed at different behavioral effects (i.e., improvement in attention and memory). Only protocols used in five or more experiments are included in the graphs with exception to four behavioral experiments in the Beta Group designated by *.
