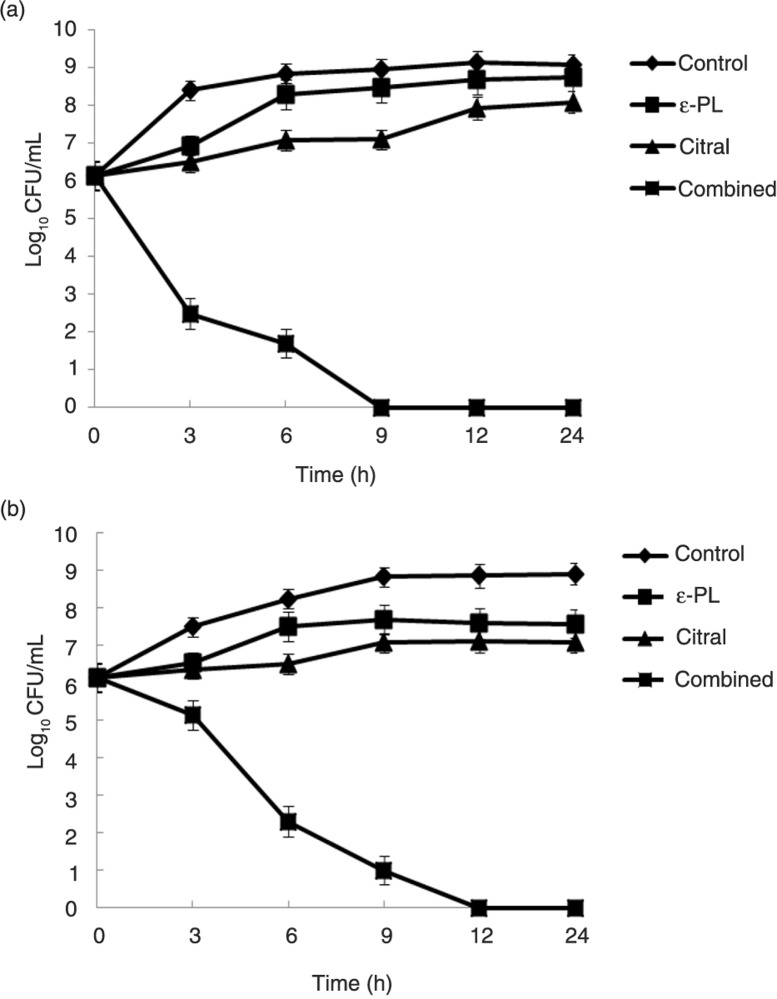
Fig. 1.
Time-kill curves for ε-PL and citral alone or in combination against E. coli O157:H7 ATCC 35150 in laboratory medium (a) and carrot juice (b). The strains were exposed to in vivo concentrations of 1 µg/mL ε-PL, 0.5 µg/mL citral, and 1 µg/mL ε-PL+0.5 µg/mL citral at a starting inoculum of 106 CFU/mL. Values are the means of three independent experiments with the standard deviation indicated by vertical bars.

