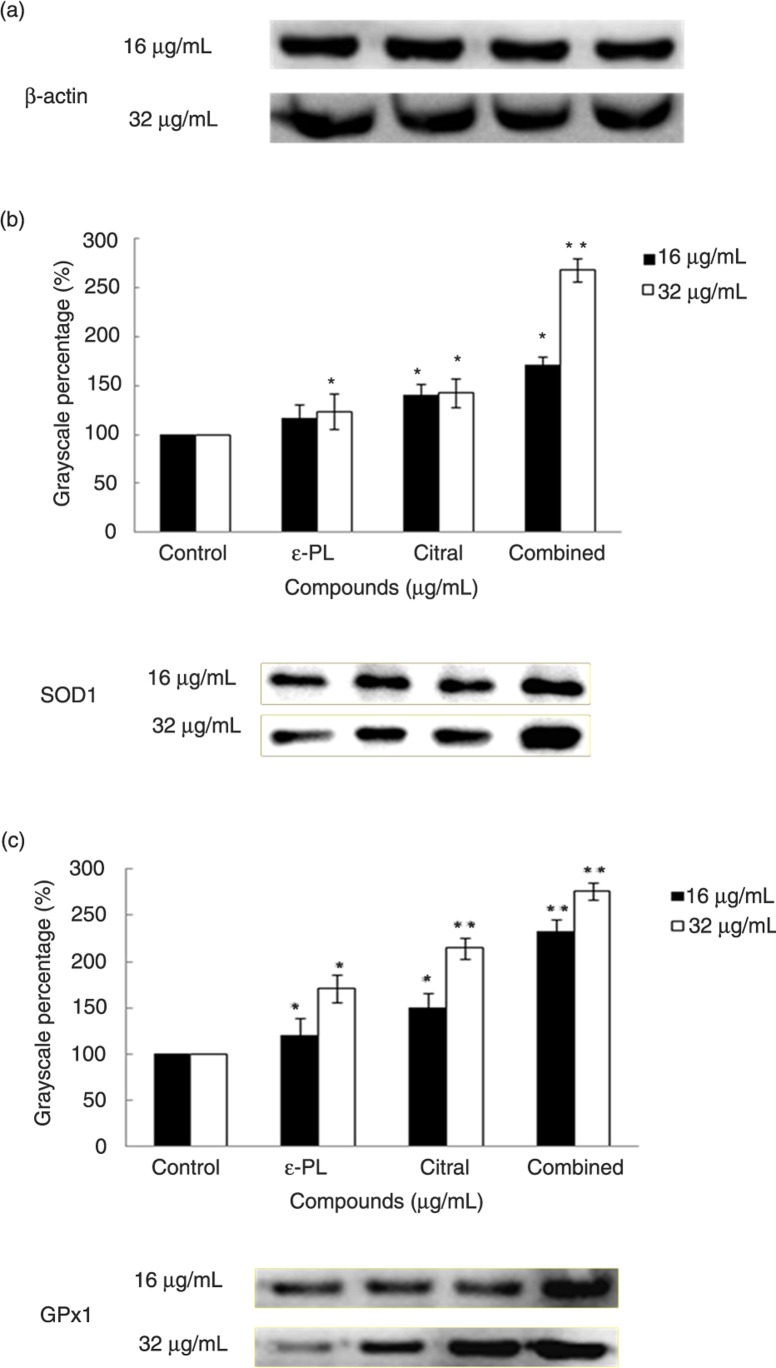
Fig. 3.
Western blot analysis of SOD1 (a) and GPx1 (b) production in L-02 cells treated with different concentrations of ε-PL and citral alone or in combination. To obtain accurate results, protein blots were measured using the Image-J software. The values show the means±SD for three independent experiments (*p<0.05, **p<0.01).

