Figure 1.
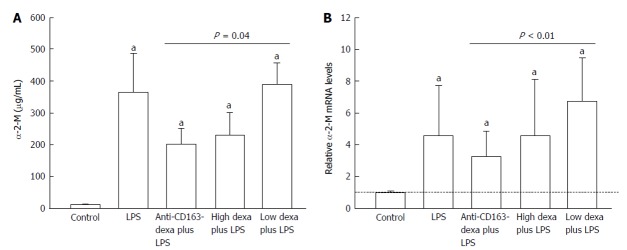
Relative levels of serum levels (A) and liver mRNA (B) of α-2-macroglobulin. Changes in serum levels (μg/mL) (A) and liver mRNA (% of controls) (B) of α-2-macroglobulin (α-2-M) in controls (n = 8) and in animals injected with LPS 24 h after vehicle (n = 8), anti-CD163mAb-dexa (n = 8), high dose (n = 8) and low dose (n = 8) dexamethasone. mRNA results from LPS-injected animals are presented as relative levels compared to control animals. Bars represent the mean and SEM. aP < 0.05 vs controls. LPS: Lipopolysaccharide; SEM: Standard error of mean.

