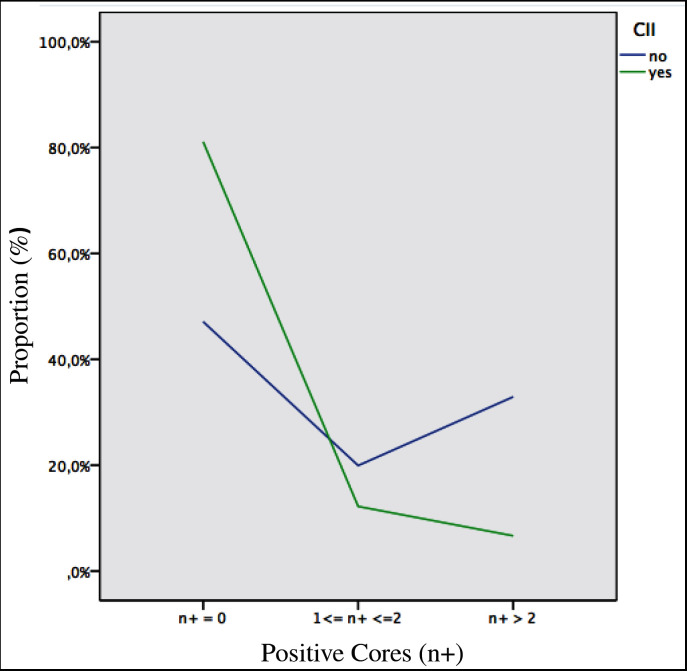
Fig. 2.
Proportion of tumour positive cores according to the presence or absence of CII in the biopsy core specimen in the cohort of patients who are stratified into three groups that include patients whose number of positive cores are zero (n+ = zero; control group), between 1-2 or more than 2 (see results and discussion for details). n+, number of positive biopsy cores; n+ = 0, negative cores; 1 ≤ n+ ≤ 2, positive core between 1 and 2; n+ >2, positive cores more than 2.

